0:00
0:00
/ 0:00
Only 12% of experiments produce a statistically significant improvement on their primary metric. Teams are just as likely to see a negative result as a positive one.
It is evidence of how difficult it is to change user behavior. However, when viewed as a system rather than isolated tests, experimentation turns uncertainty into compounding learning and meaningful impact.
Across Optimizely customers, each revenue-focused experiment delivers an average incremental 0.4% lift in digital revenue when results are applied, refined, and built upon over time.
So how can experimentation work for you?
The highest-performing experimentation teams master four key pillars:
This guide covers what that program looks like, based on our analysis of 127,000+ experiments.
1. Bad metrics
Over 90% of experiments target five common metrics: CTA clicks, revenue, checkout, registration, and add-to-cart. Three of those five have the lowest expected business impact of any metric category we track. When primary metrics sit too far downstream from the tested change, tests take longer to conclude, more results come back inconclusive, and the program loses momentum.
2. Velocity without quality
Are you running enough experiments, or too many?
Our data shows that the median company runs just 34 experiments a year:
The common myth: Running more tests automatically leads to better results.
The data tells a different story: Our analysis reveals that impact per test peaks at 1-10 annual tests per engineer. Beyond 30 tests per engineer, the expected impact drops by a staggering 87%.
3. No memory
A test result is shared in chat, and nobody acts on it. A hypothesis meeting surfaces the same idea someone tested eight months ago, except nobody remembers the result. This is what happens when a program has no organizational memory. Without it, nothing compounds.
4. A/B-only thinking
Most experiments today are simple A/B tests, and that’s a missed opportunity. Our data shows:
Teams that stay in A/B-only mode cap their ceiling before they know they're capping it.
These roadblocks share a common cause. Programs built as collections of tests rather than repeatable systems produce results, but not learning. Without the system, nothing accumulates into anything leadership can act on.
To move from incremental improvements to breakthrough results, you need to democratize experimentation and keep your developers sane.
Here's Sathya Narayanan, Director, Product Management on the need for democratization of experimentation and what it actually means.
Most teams measure whether individual experiments win or lose. That tells you whether a test worked. It doesn't tell you whether the program is working.
High-performing programs use a goal tree that links what gets tested to what leadership measures.
![]() Image source: Optimizely
Image source: Optimizely
Every experiment's primary metric should trace cleanly from an optimization goal to a strategic metric to the North Star. If the trace isn't obvious before the test runs, the test isn't aligned, and a win on it won't change what anyone decides.
Alongside the goal tree, three metric roles inside each experiment:
Set them before launch. Don't change them mid-test. A simple rule: if the primary metric does not change, the experiment has not achieved its goal, regardless of what happens elsewhere.
Most programs track win rate alone, and most interpret it incorrectly. A healthy win rate is 10 to 30%. A healthy conclusive rate, wins and losses combined, is 35 to 40%.
The signal to watch is the conclusive rate, not the win rate. Inconclusive tests are the real drain. Experiments that consume traffic and time without reaching a clear result destroy velocity and erode the stakeholder confidence that keeps programs funded.
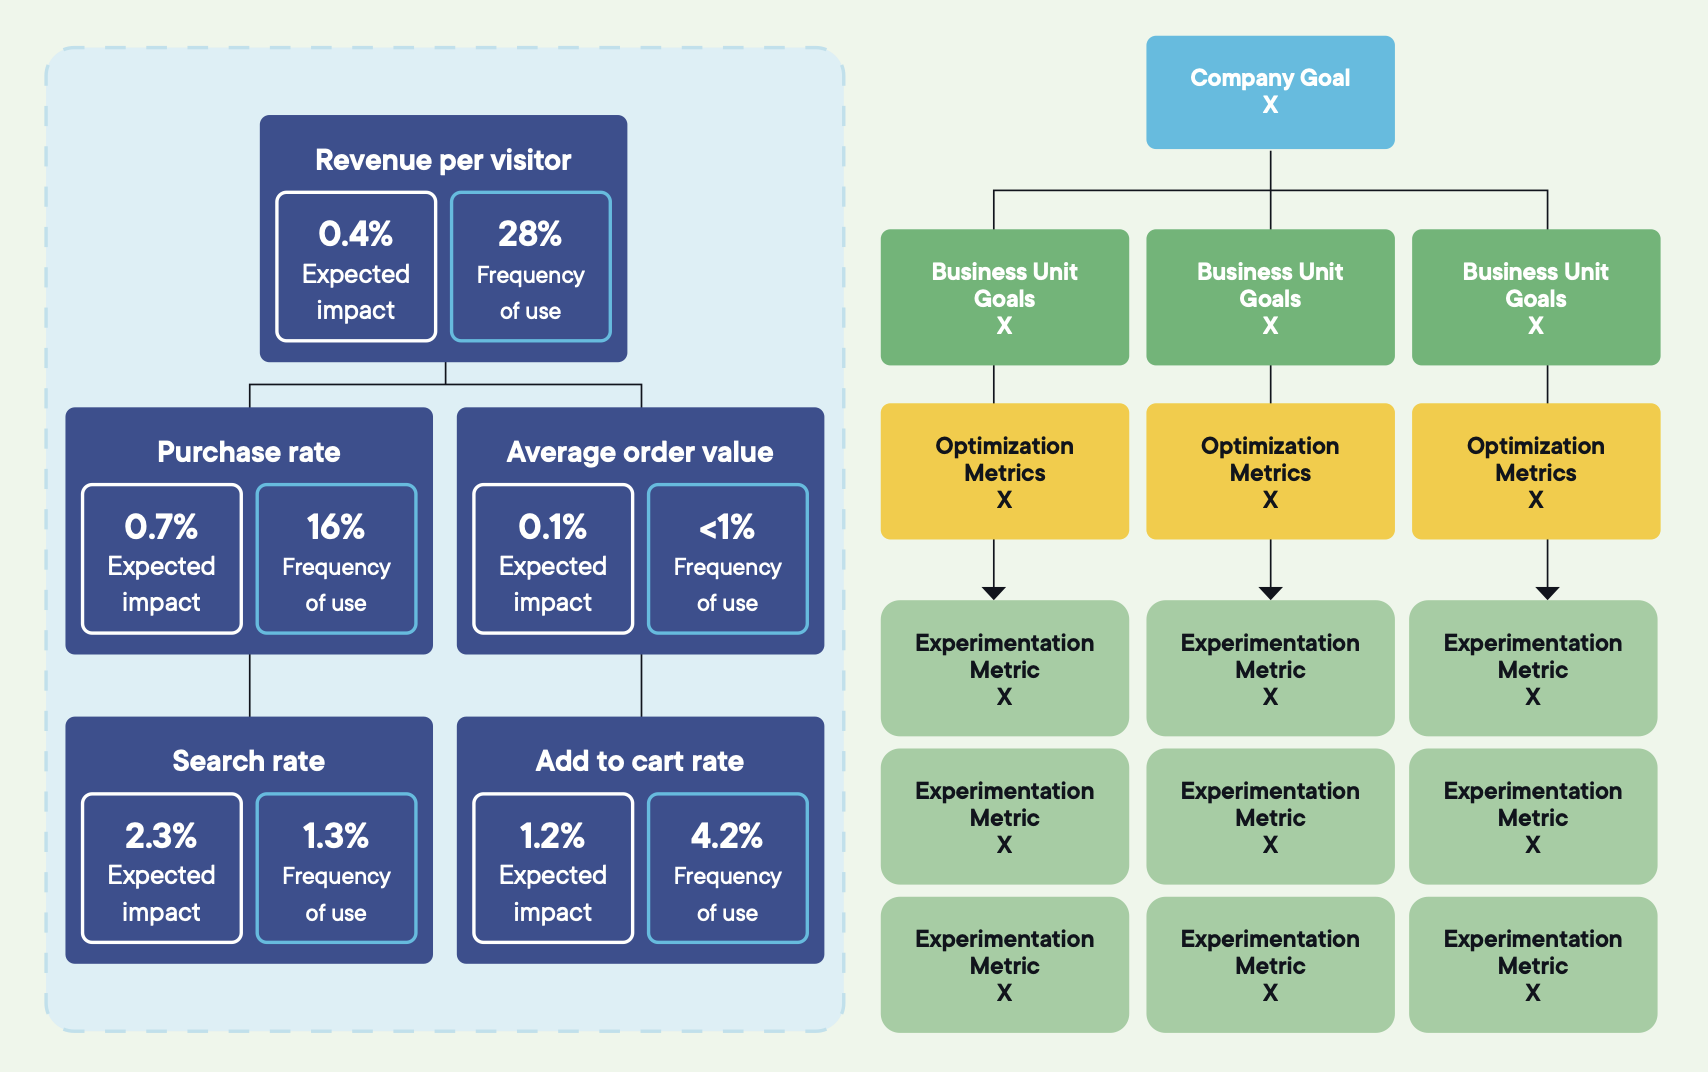
Image source: Optimizely
Three program-level measures matter once cadence is steady.
Every program has more ideas than capacity. Without a shared prioritization model, the loudest stakeholder wins, and backlogs start to look like the org chart.
RICE gives every idea a consistent score before it enters the backlog
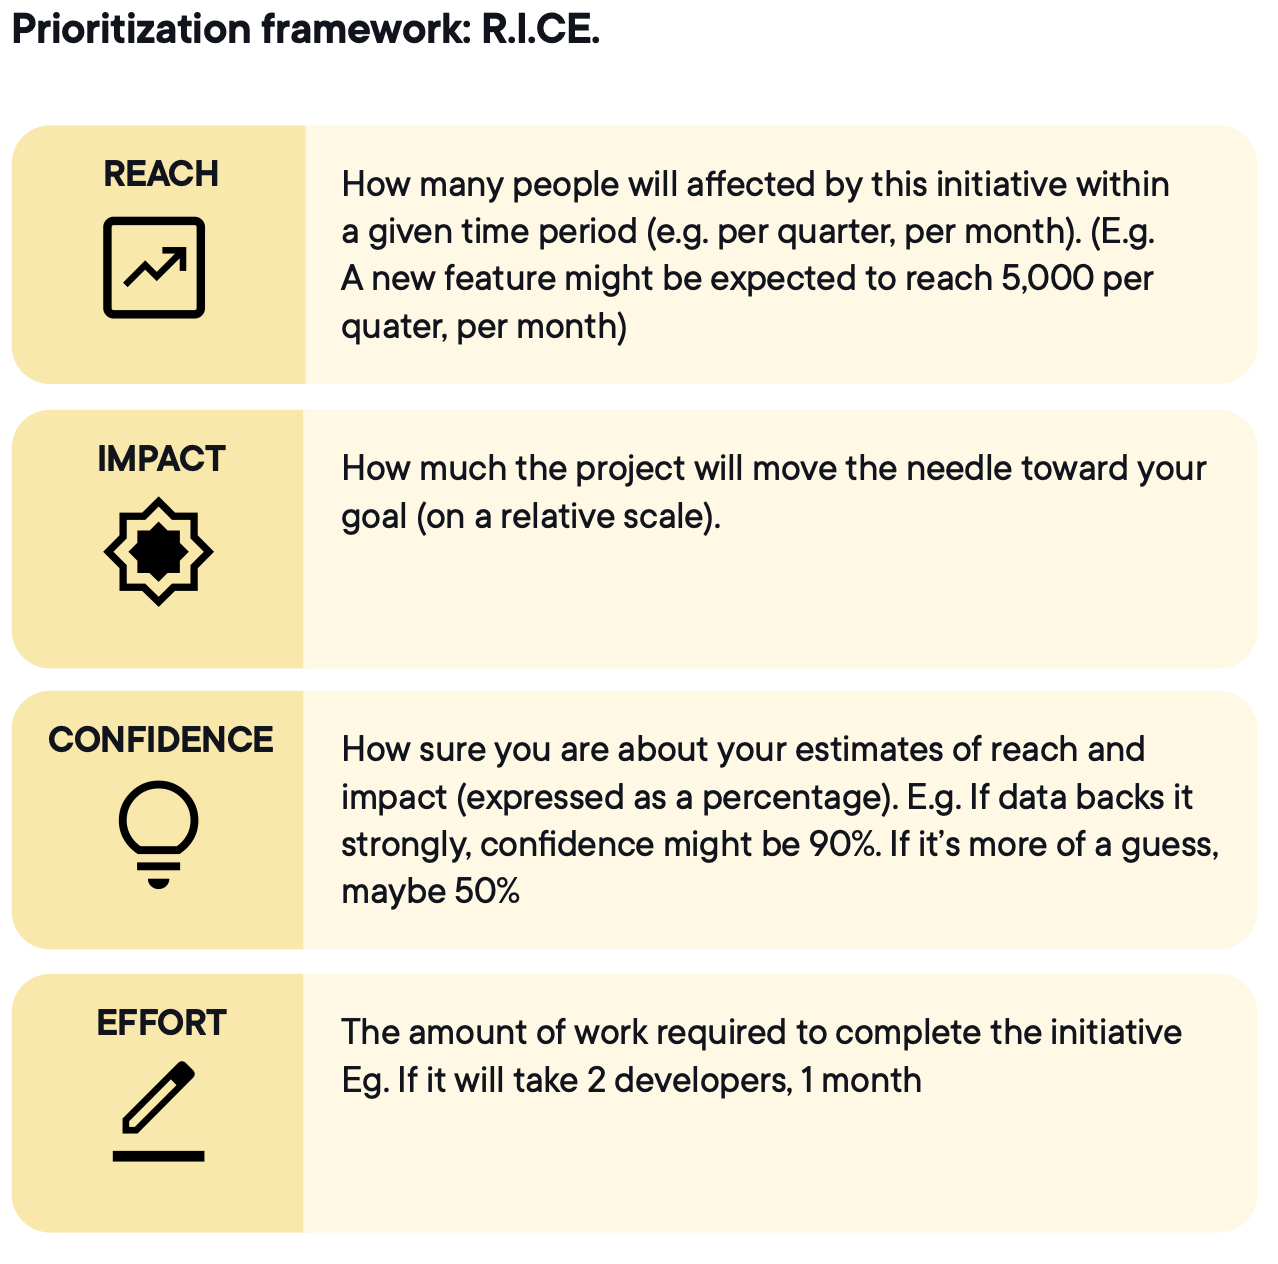
Image source: Optimizely
Confidence is the dimension most teams score on gut feel. It should be tied to data, prior experiments, or research. A confidence score based on intuition is optimism with a number attached.
Foundations tell you what to measure and how to track program health. The lifecycle is how each experiment actually runs. Six stages. Each feeds the next. When one breaks, learning stops compounding. When all six hold, each experiment makes the next one smarter.
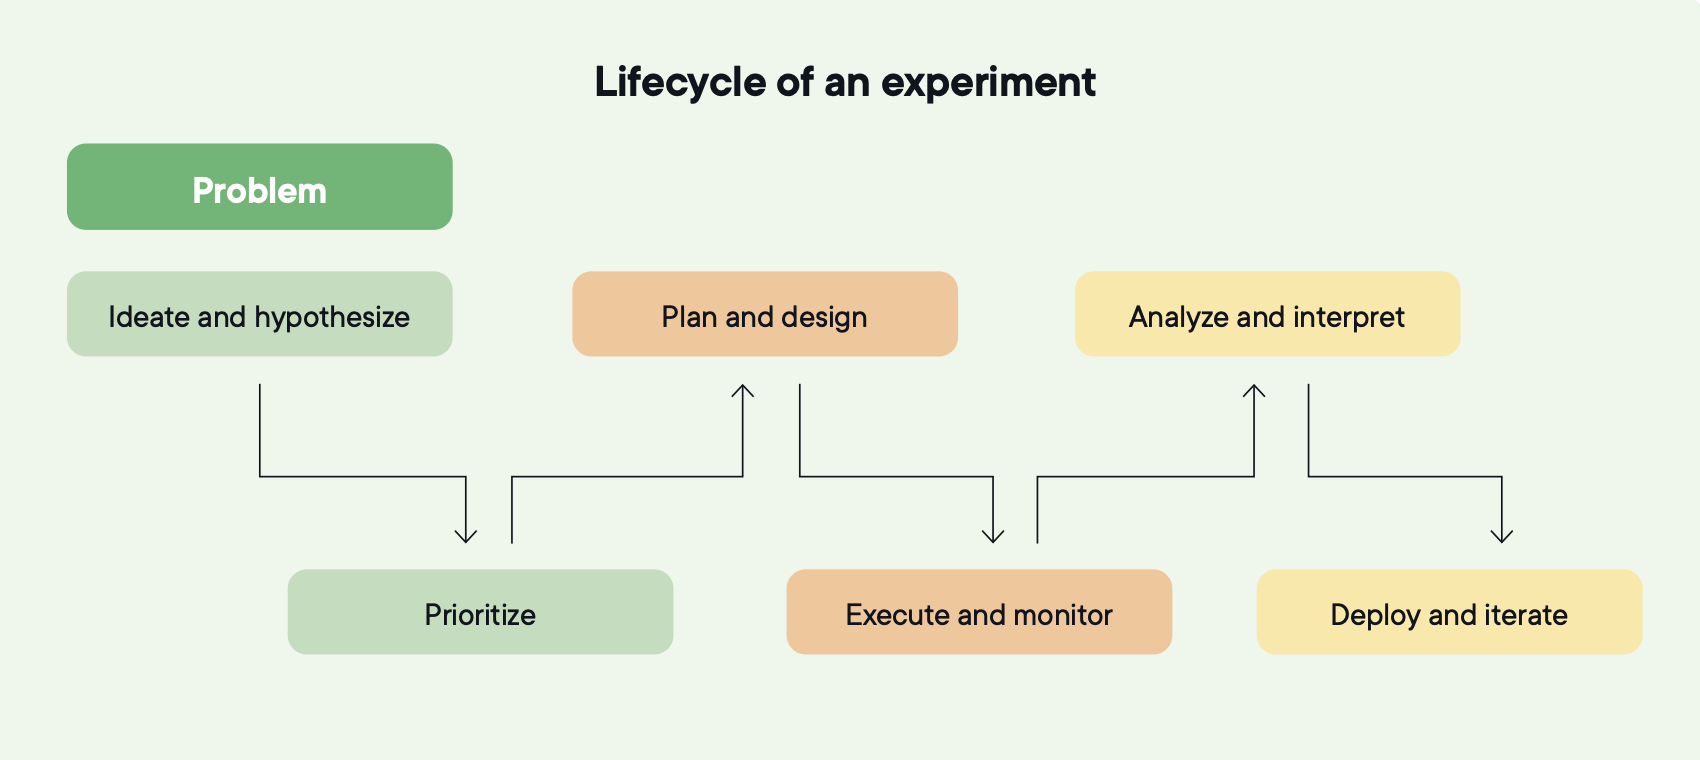
Image source: Optimizely
Most tests fail before anyone writes a hypothesis. High-performing programs triangulate across three inputs before ideation begins:
Used together, they help distinguish symptoms from root causes and avoid testing surface-level fixes.
The output is a problem statement specific enough to guide ideation without locking teams into a solution. Not "users aren't converting" but "users don't understand how delivery fees work until the final checkout step, and 25% of surveyed users say that's why they left."
The PSR framework keeps this discipline across the program.
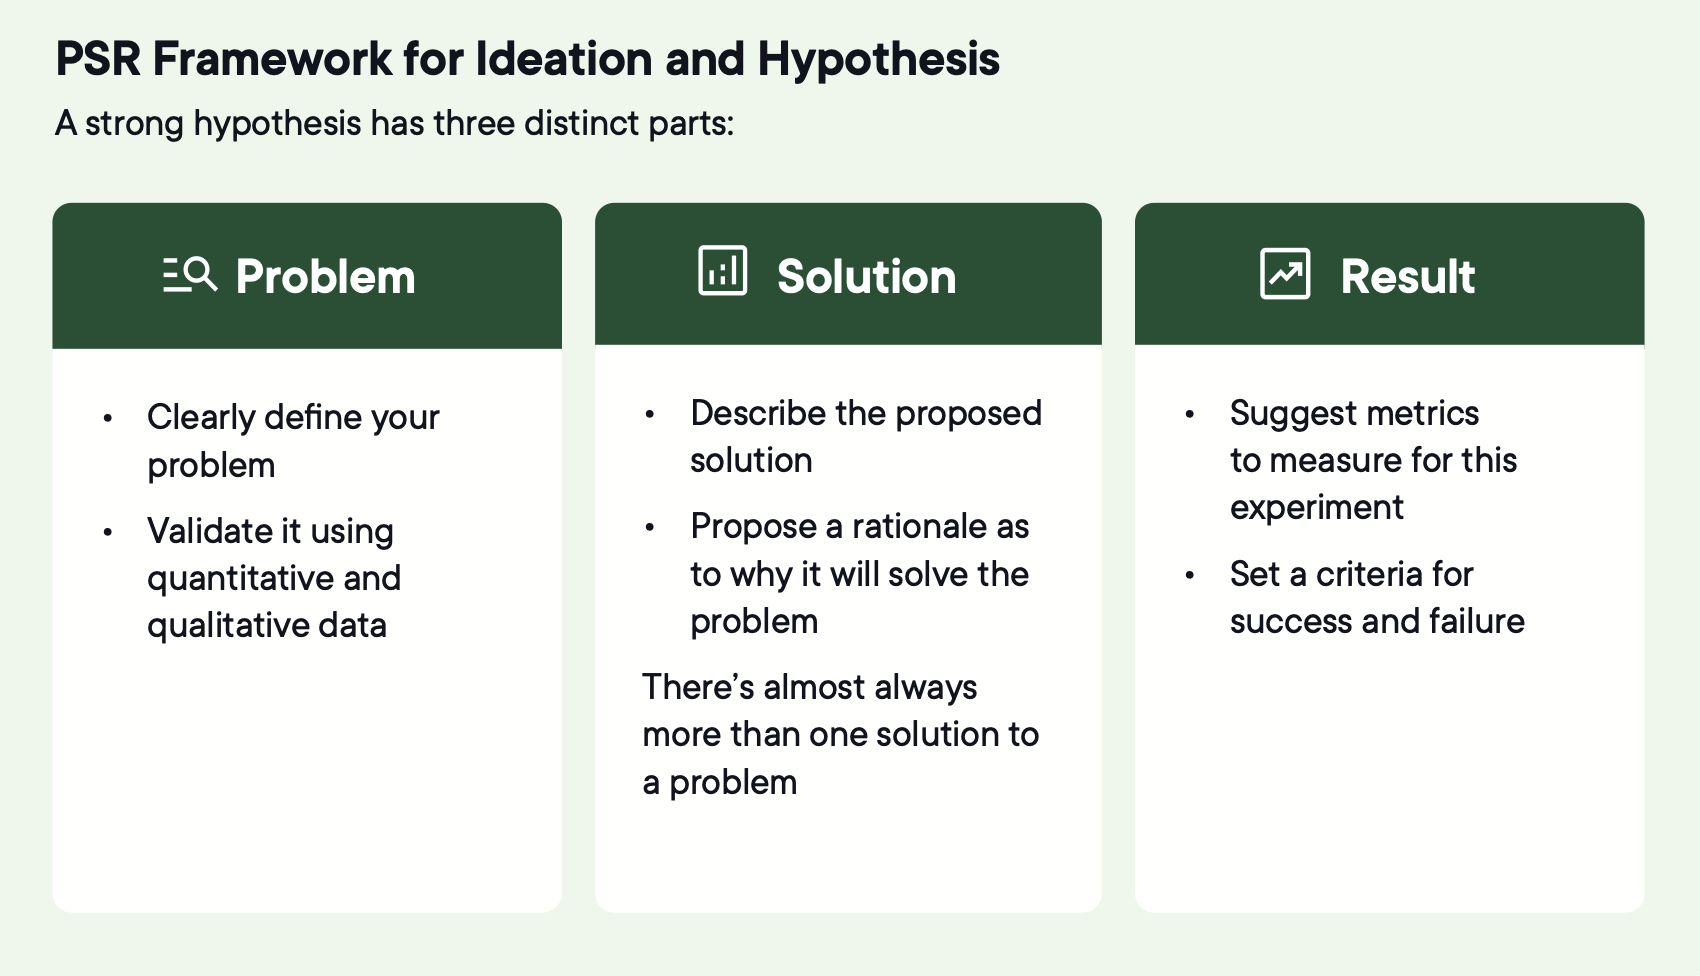 Image source: Optimizely
Once the problem is validated, generate three to five testable solutions, not just the safest possible change.
Testing multiple competing solutions increases the likelihood that at least one produces meaningful improvement.
It also changes how teams work. Risk-taking increases because safer options are covered. Ownership broadens because more contributors see their ideas tested.
A full backlog is not the same as a good one. RICE scores rank ideas. Before committing anything, check for shared audiences, platform timing, seasonal windows, and experiments where one result should inform the next.
A balanced backlog intentionally mixes:
A good hypothesis becomes a bad experiment when planning is skipped. Before launch, confirm:
Will this experiment conclude within a reasonable timeframe?
Will the expected traffic be sufficient to detect whether the change had an effect?
Target as broadly as the hypothesis allows. Over-targeting slows learning by shrinking the available audience and making results harder to apply to the broader experience.
Define segments upfront when there's a clear hypothesis that different audiences will respond differently. Segmentation applied after results come in to find uplift somewhere increases the risk of false positives and leads to conclusions that are hard to trust or repeat.
Choose the right experiment type.
| Experiment type | What it is | When to use it |
| A/B test (Single variant) | Compares one variation against a control | When validating a clearly defined change with a focused hypothesis, especially with limited traffic |
| A/B/n test | Tests several alternative solutions against the same control | When exploring different ways to solve the same problem and increasing the chance of finding a winner |
| Mutlivariate test (MVT) | Tests combinations of multiple elements simultaneously | When interaction between elements matters and traffic volume is high |
|
Mutli-armed bandit | Dynamically reallocates traffic toward better-performing variants | When the goal is to maximize performance during the experiment rather than pure learning |
| Contextial bandit | Allocates variants based on user attributes or context | When different audiences are expected to respond differently |
| Personalization experiment | Delivers tailored experiences to defined audiences and measures impact | When testing whether personalization outperforms a generic experience |
| Feature or product experimentation | Tests functional or logic-based changes, often server-side | When validating product decisions, workflows, or algorithms |
| Houldout test | Uses a control group that receives no change to isolate causal impact | When effects cannot be isolated with standard A/B testing |
The right experiment type can help you achieve better results. For example, personalized experiences generate 41% higher impact than generic ones.
Every experiment needs a test plan agreed upon before launch. It captures the hypothesis, experiment type, variations, targeting, primary metric, decision rules, and risks. Without it, results get interpreted against whatever question seems most convenient once the data is in.
Execution is where well-designed experiments break.
The first few hours should focus on correctness, not performance:
Expect volatility early. Don't evaluate performance during this window. The objective is validation, not interpretation.
Once launch validation is complete, monitoring shifts to protecting integrity. Watch for unexplained shifts in audience mix, traffic inconsistencies, or conflicts with other experiments running on the same audience.
Once an experiment is live, treat the design as fixed. Any changes to variants, targeting, or metrics introduce bias and make the result unreliable. Pause only to protect users or the business. Terminate only based on predefined criteria. Document any external events that occur during runtime.
Stop if the primary metric reaches statistical significance and the test has run for at least two weeks to capture normal user behavior patterns, it can be stopped. Also, stop if the test has run its planned duration, accumulated substantial traffic, and results remain far from significance, classify it as inconclusive and move on.
The most common failure in analysis happens before anyone looks at the data.
Connecting experiments to the warehouse means analyzing against lifetime value, return rates, and retention rather than clicks and conversions. As AI search takes over discovery, clicks are becoming less predictive of business value. The metrics that will matter going forward live in the warehouse.
Shipping a winner is not the same as compounding a learning.
Confirm the decision still holds. Ship exactly what was tested. Last-minute tweaks alter the mechanism that produced the result. Any production adjustment gets documented.
Monitor the same primary metric and guardrails post-launch. Then iterate:
Compounding only works if results change what happens next. Most teams have felt what breaks this. A test result shared in Slack that nobody acted on. A hypothesis meeting where the same idea came up that someone had tested eight months ago, except nobody remembered the result. That's what happens when a program has no memory.
Structure beats improvisation. Written beats verbal. Widespread input beats small groups. The programs that compound are the ones where anyone can find what was tested, what was learned, and what comes next.
58.74% of all Optimizely agent usage is experimentation.
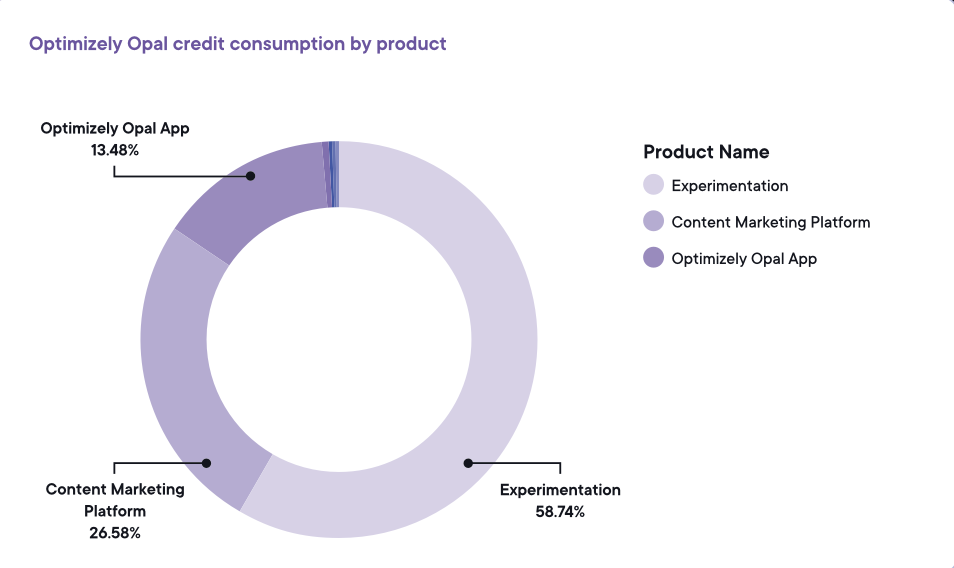 Image source: Optimizely
But for most teams, that still means prompting for ideas, getting a response, and moving on.
There's a difference between a chatbot and a workflow agent. A chatbot responds when you ask it something. A workflow agent executes whether you ask or not. When a test concludes, the agent sees it. Summarizes the result. Generates follow-up ideas from your actual program history. Drafts plans in your format and queues them for review. You didn't ask. It just ran.
That distinction is where the data separates. Teams using agents across the full cycle, not just at the start, run 78% more experiments and see a 9% higher win rate. Creation spikes first. Conclusion rates and win rates follow as agents move into execution and analysis.
10.95% of experiments start with agent-generated ideas. Only 6.8% get summarized by agents. The back half of the cycle is where things pile up. A test that moves real metrics usually needs custom code. That means a developer ticket, a queue, a sprint, and days just to get prioritized.
The variation development agent was built to solve that bottleneck. Most AI experimentation tools generate raw code. CSS dumps. JavaScript injected onto your page. That sounds helpful until you inherit the snippet bloat and debugging sessions that follow. The variation development agent works through the visual editor's native tools. The output is clean. Changes are reversible. The human stays in control.
19.54% of follow-up tests are now driven by agent recommendations grounded in prior results. That's the back half of the cycle running without someone having to drive it.
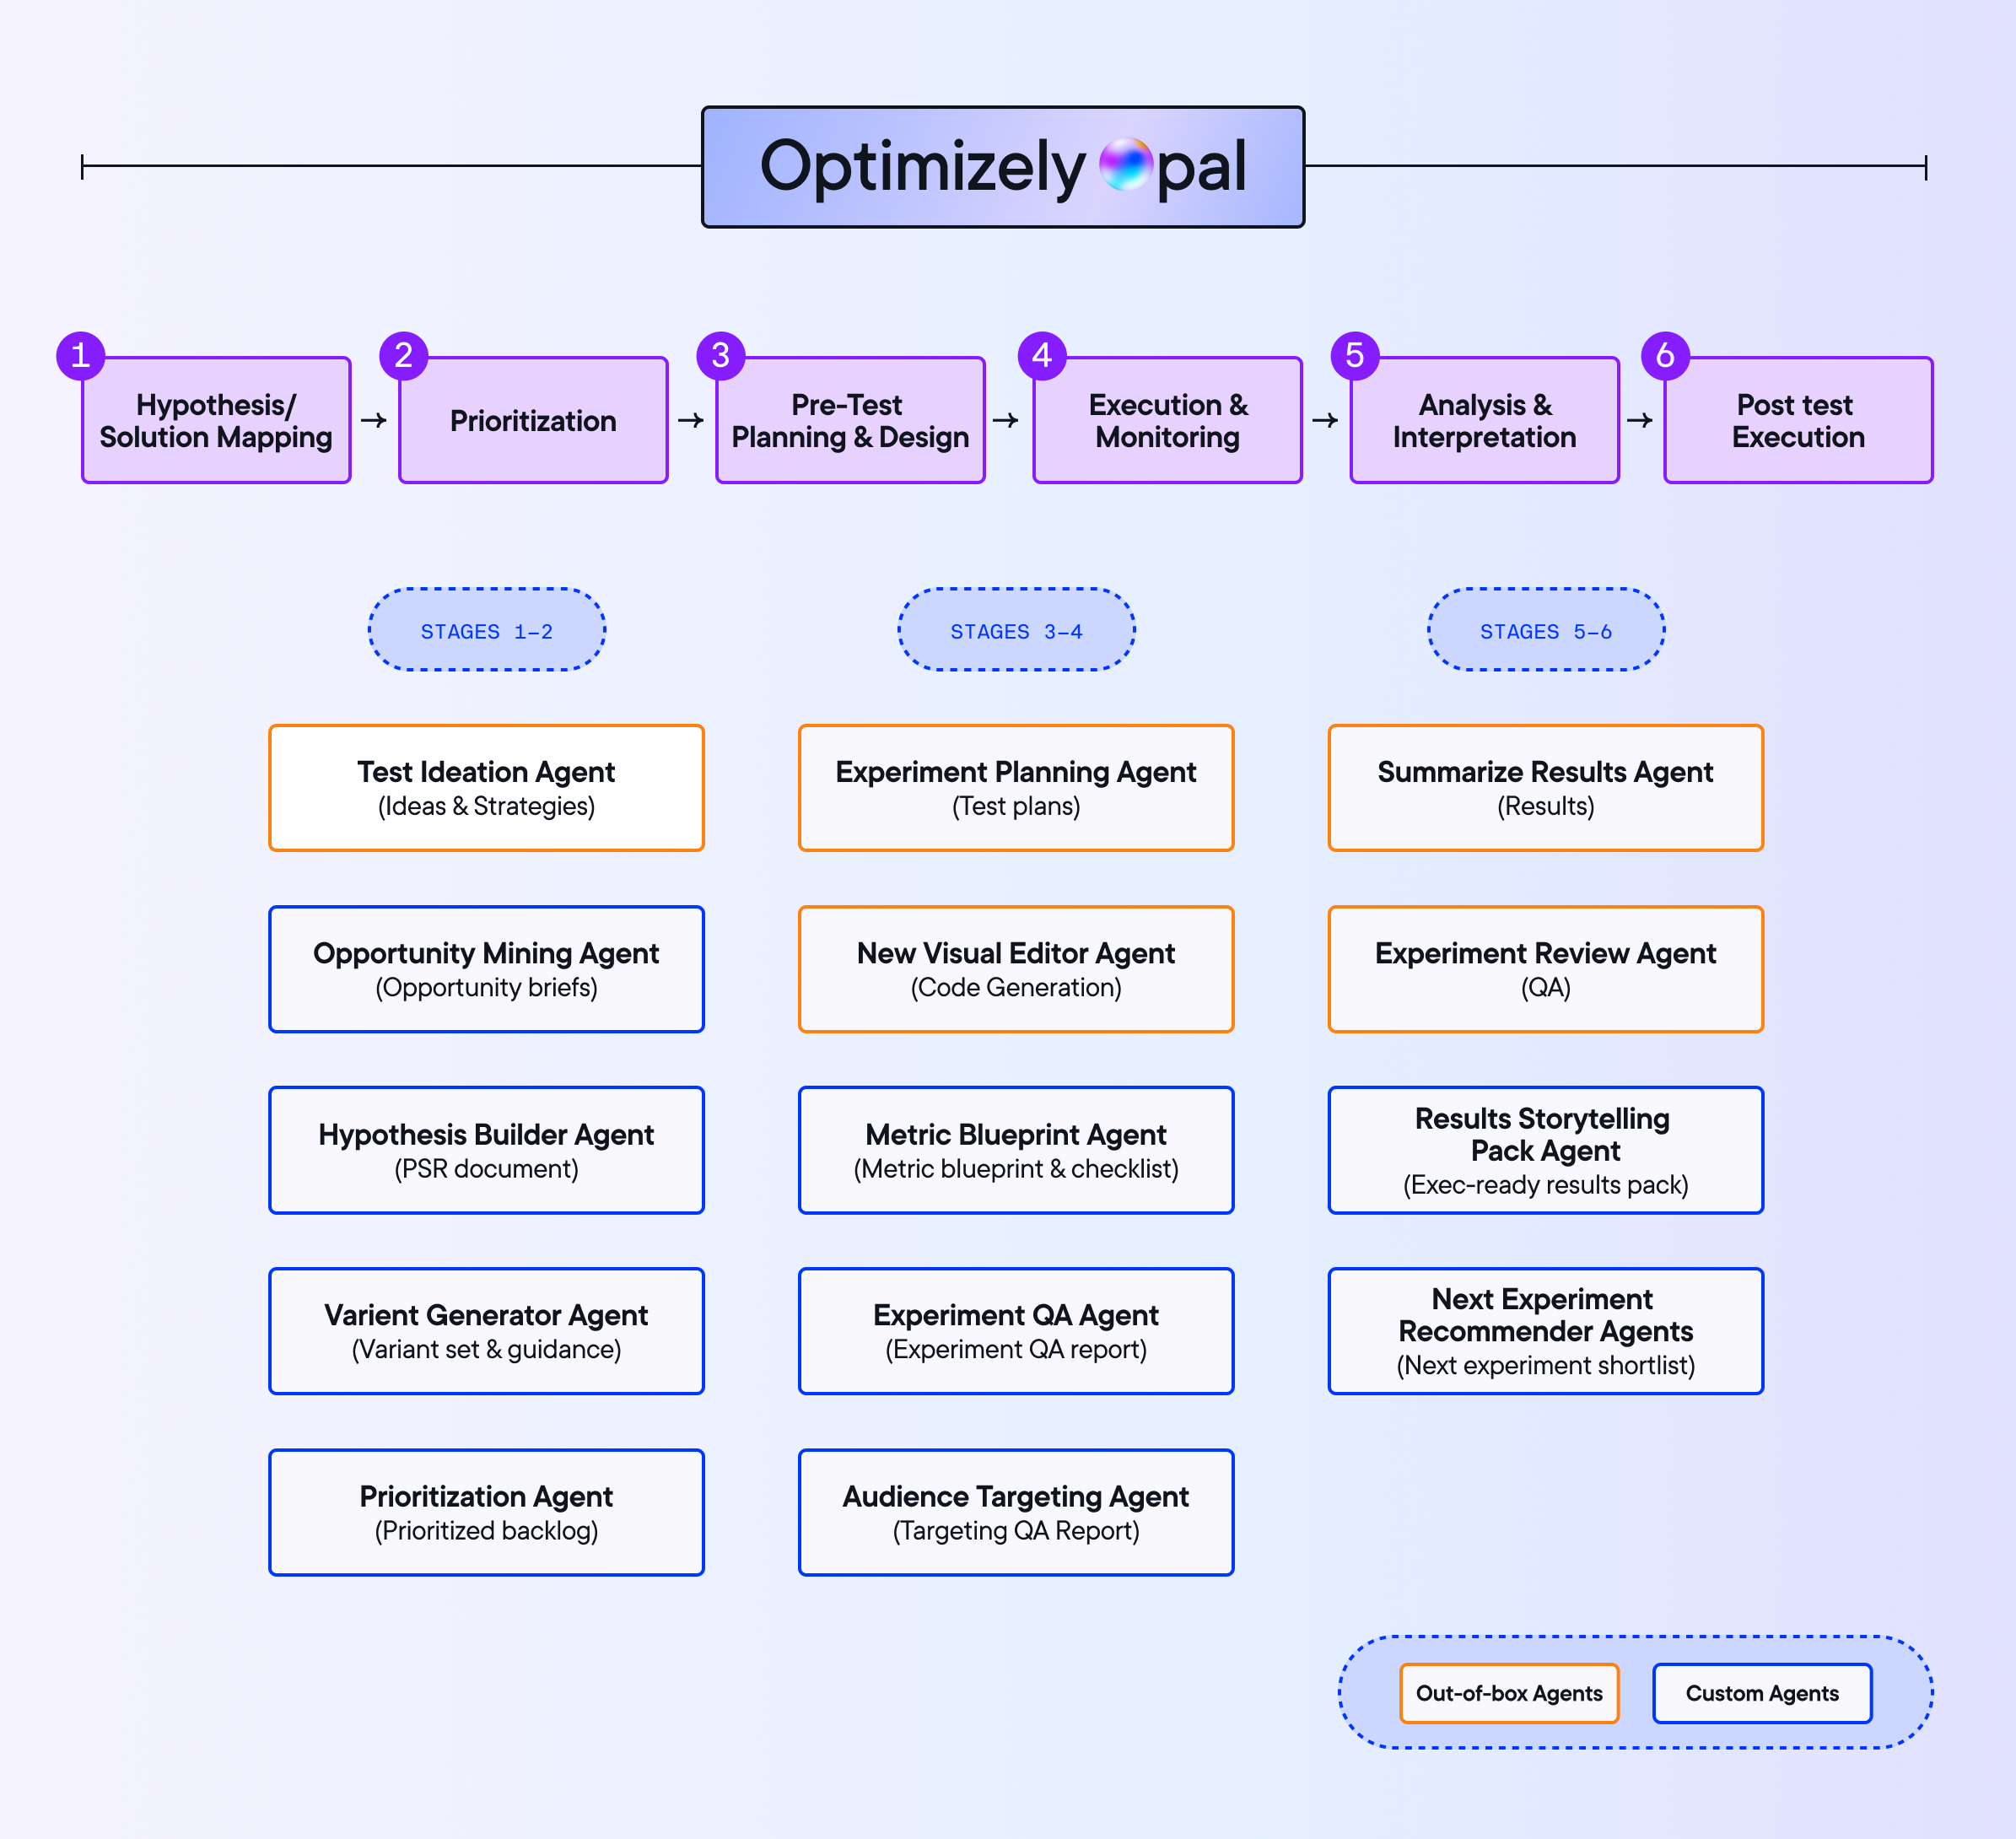 Image source: Optimizely
The bar is whether AI creates less work downstream than it saves.
For AI to work at the program level rather than just for individuals, three things need to be in place. Roles need to be defined so agents know who they're working for. Outputs need checkpoints so humans review what matters. Leadership needs visibility into what's running so teams don't unknowingly run conflicting tests on the same audience.
Point agents at a program without that structure and they accelerate the activity instead of the learning.
Each revenue-focused experiment delivers an average 0.4% incremental lift in digital revenue when results are applied and built upon. One test doesn't move that number. Running the system does.
Want to dive deeper?