ROADMAP & RELEASES
Latest updates for Analytics
Here’s what’s on the way in Optimizely Analytics—from product analytics to customer journey insights, with advanced visualizations for every dataset in your warehouse.
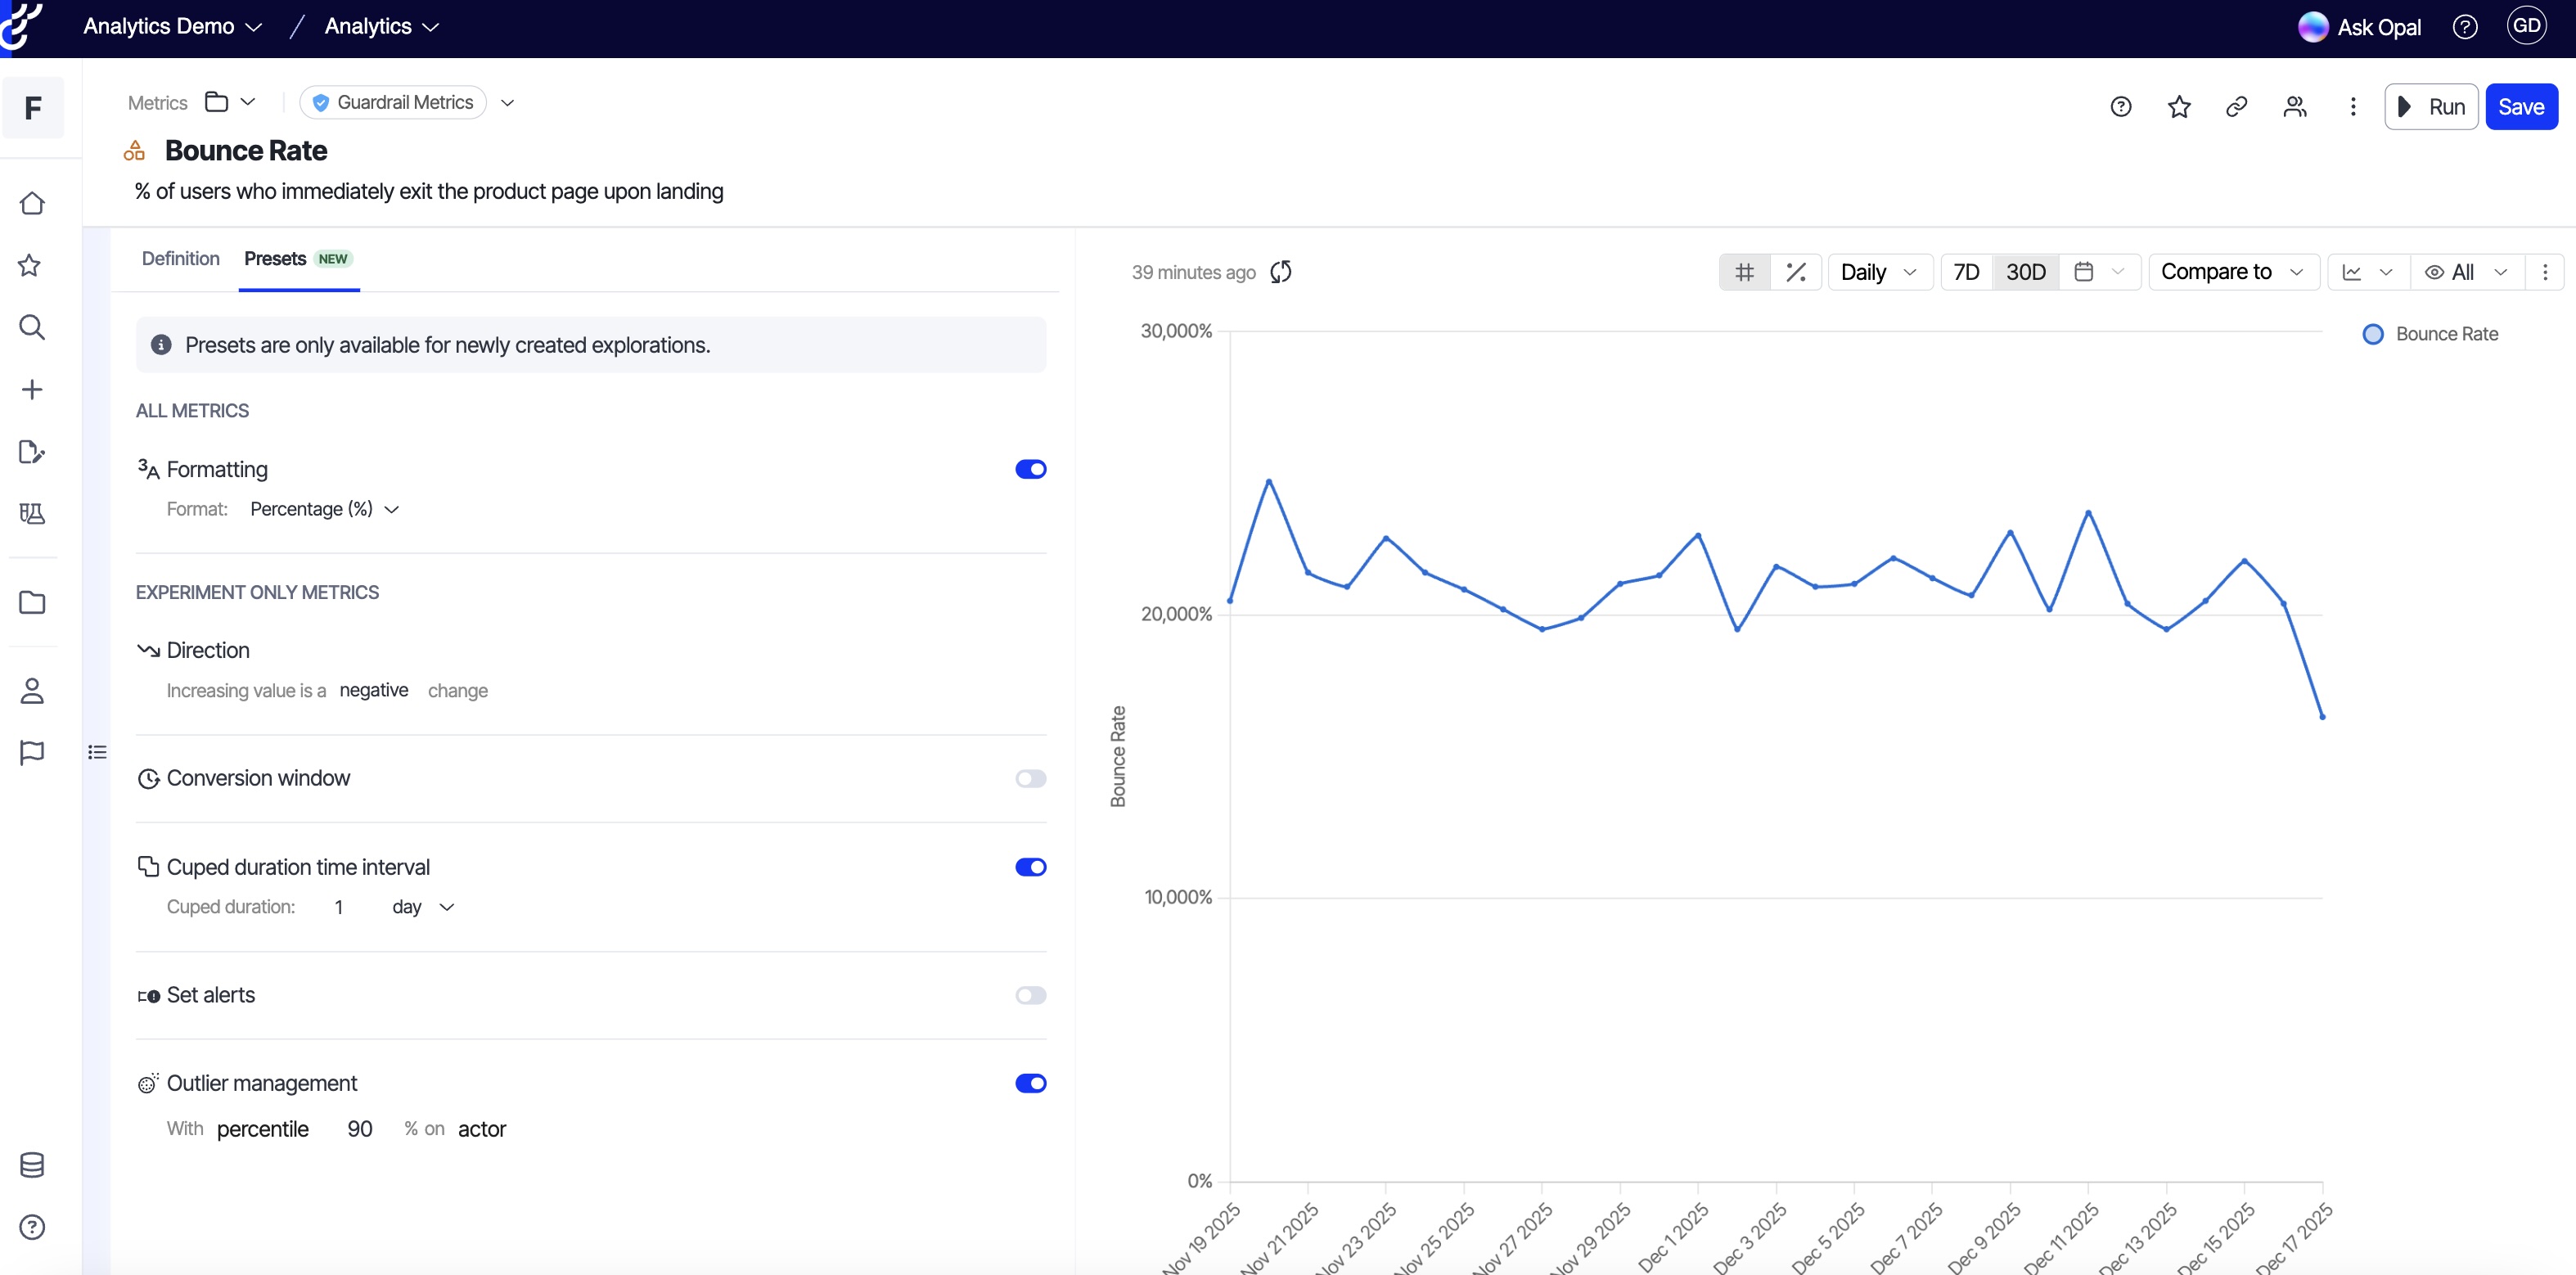
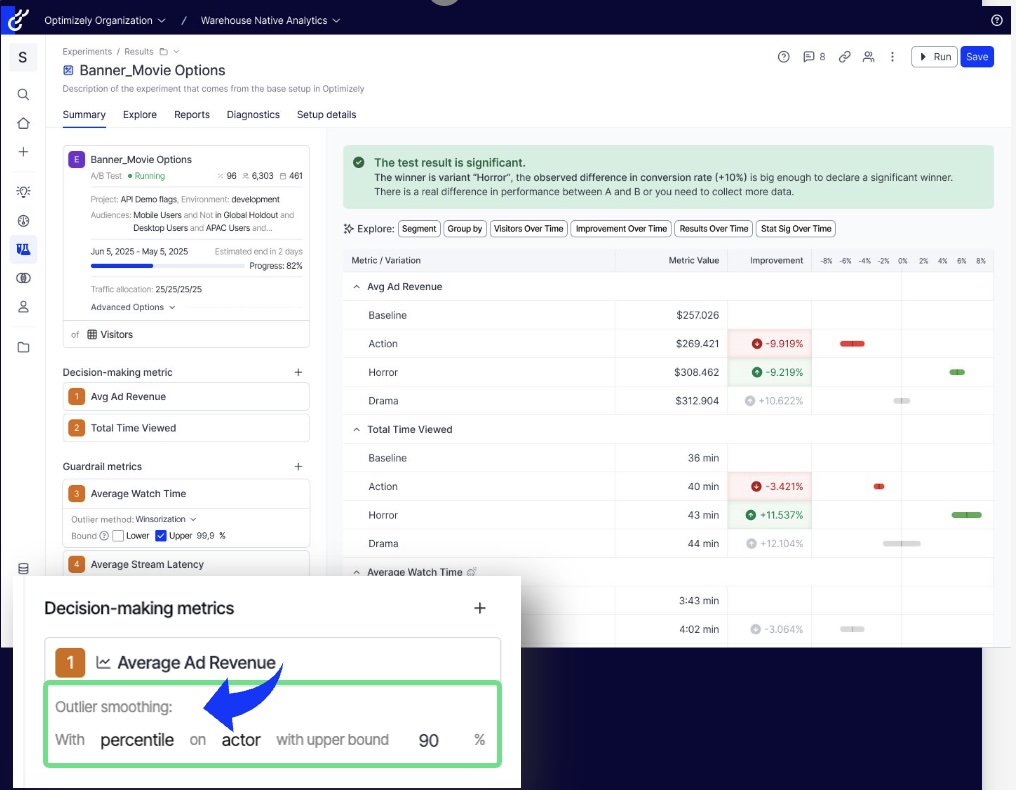
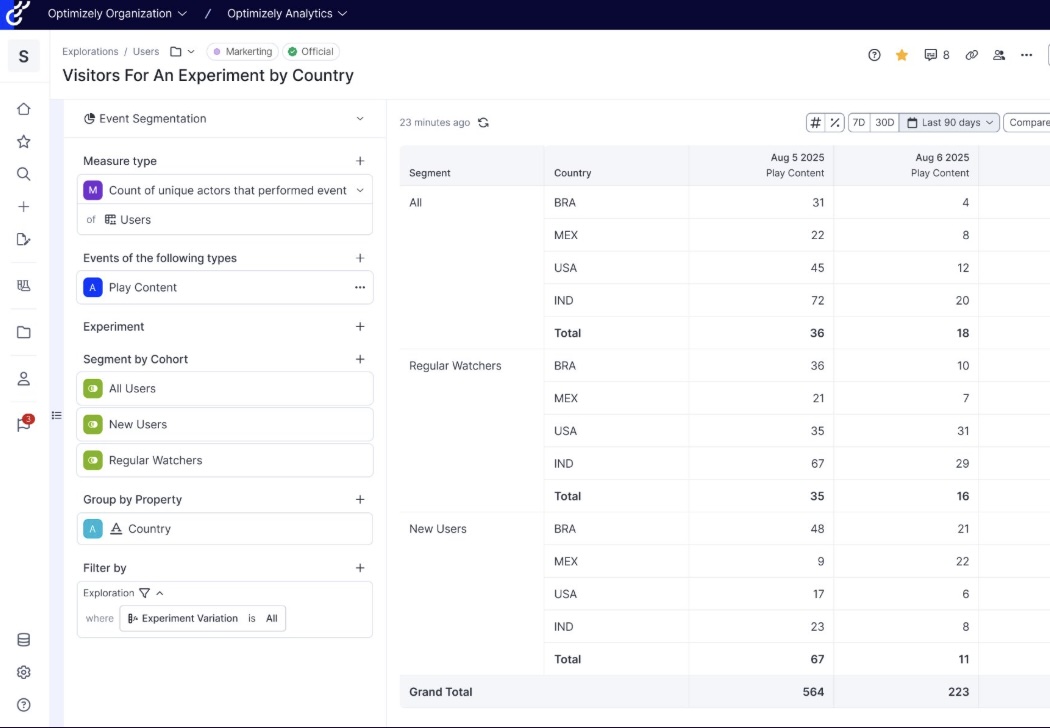
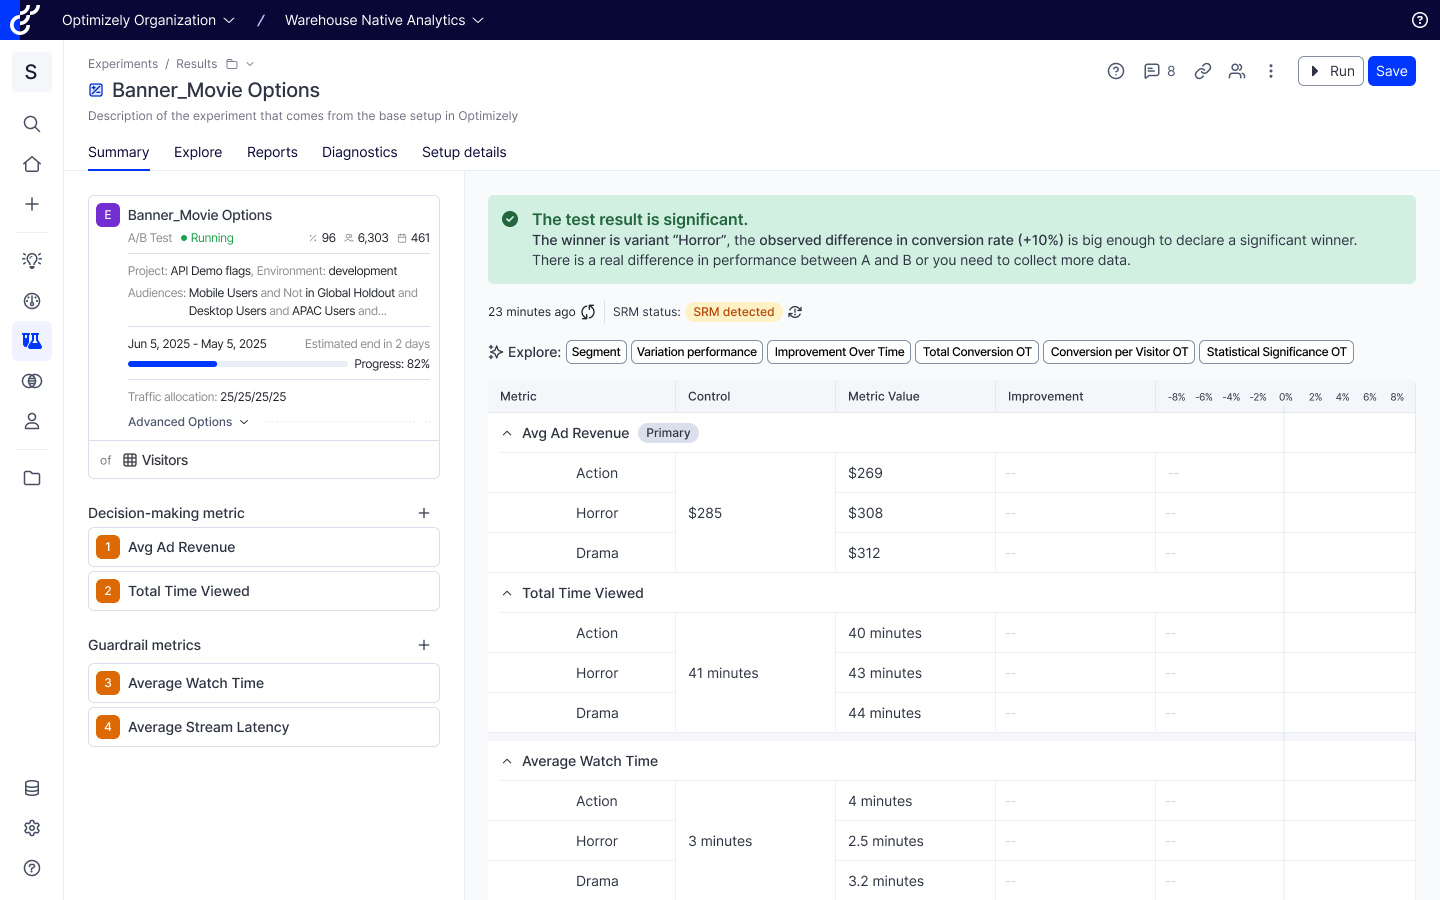
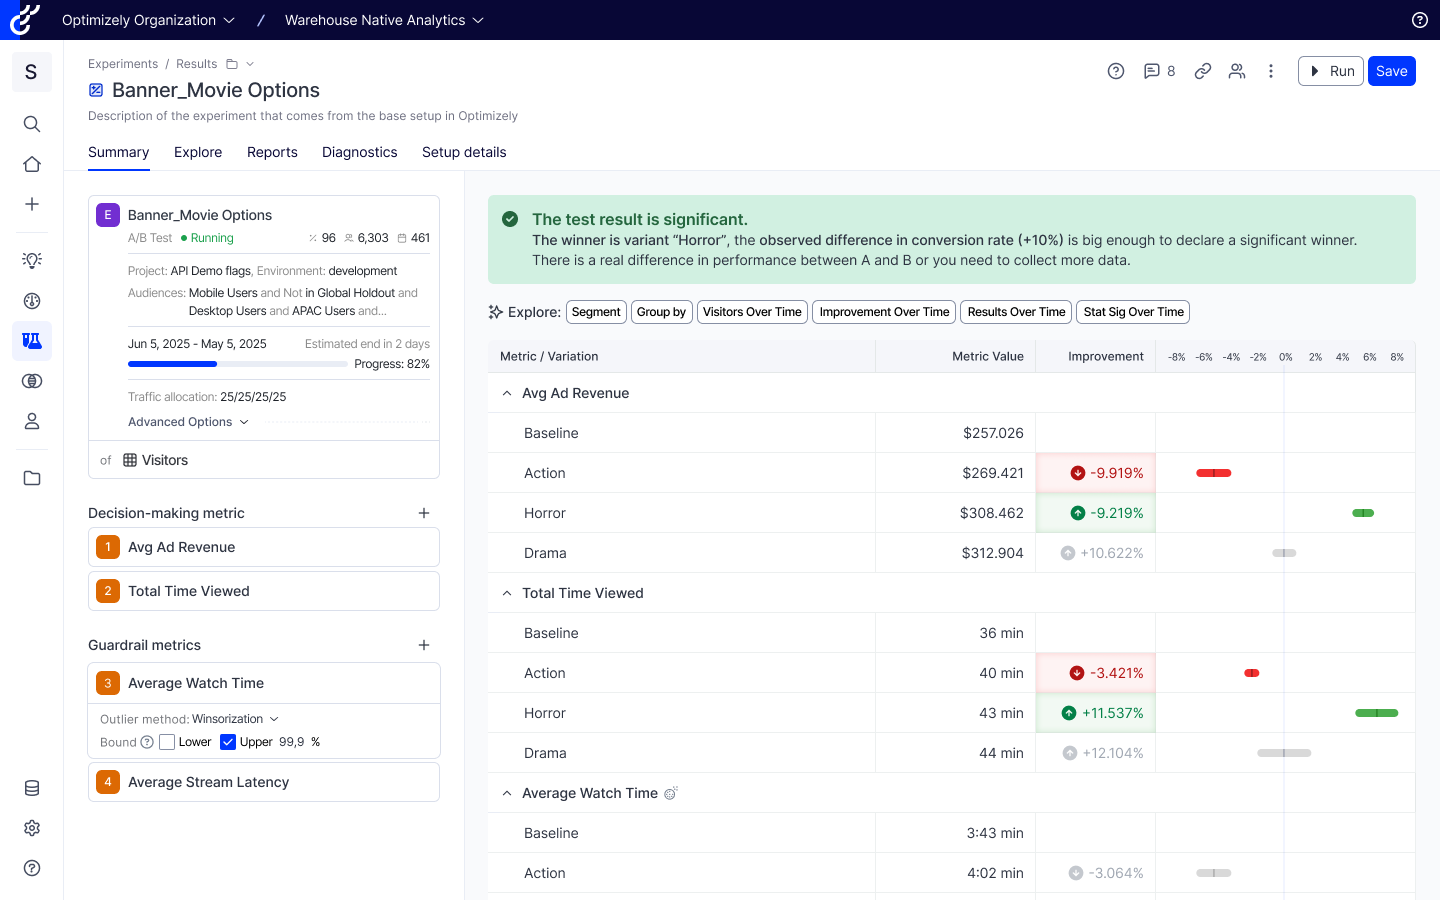
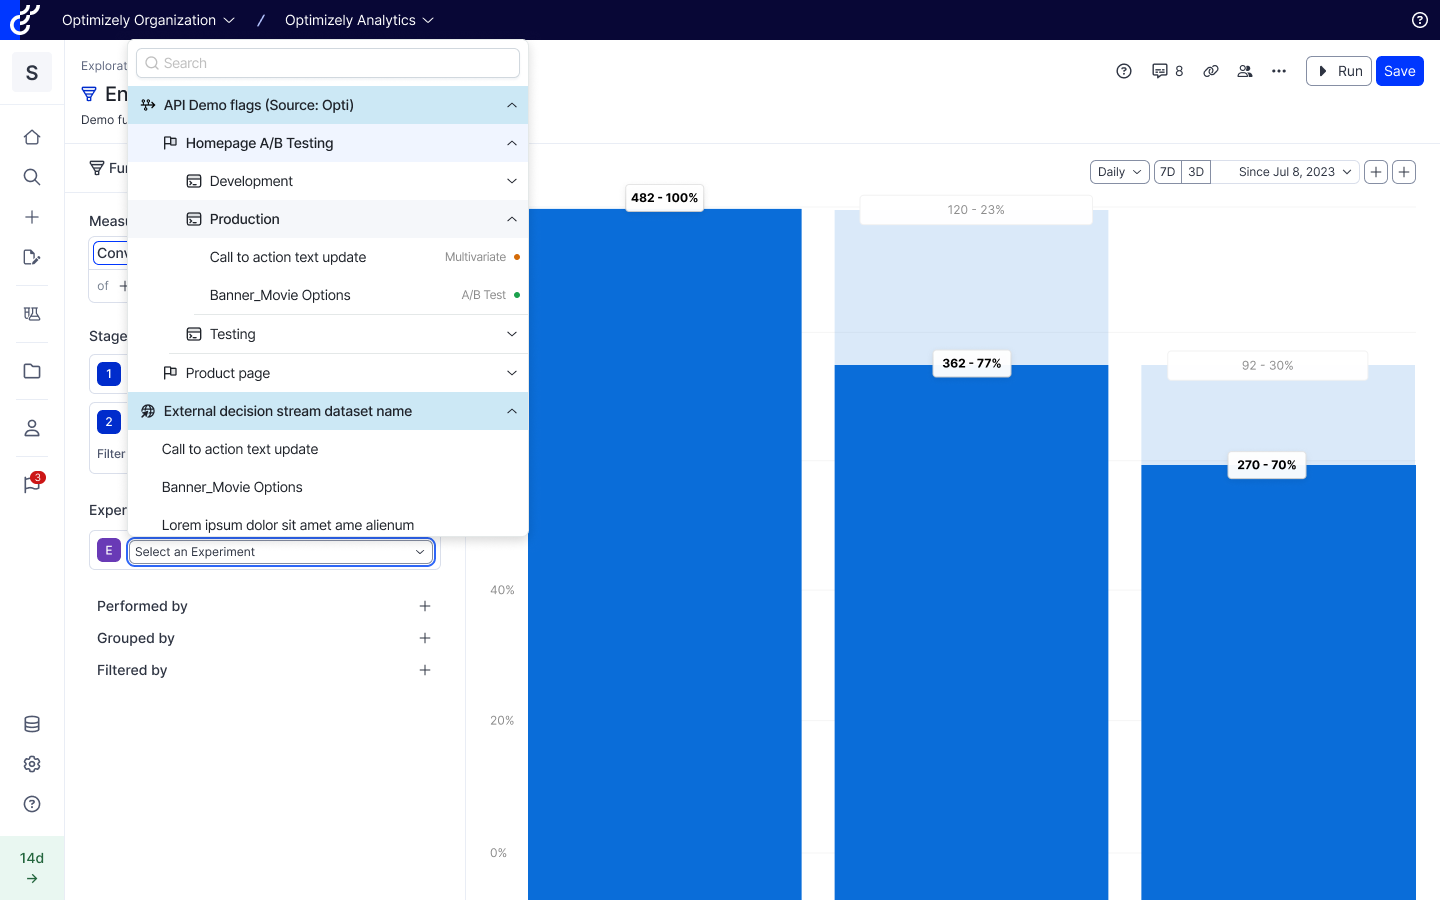
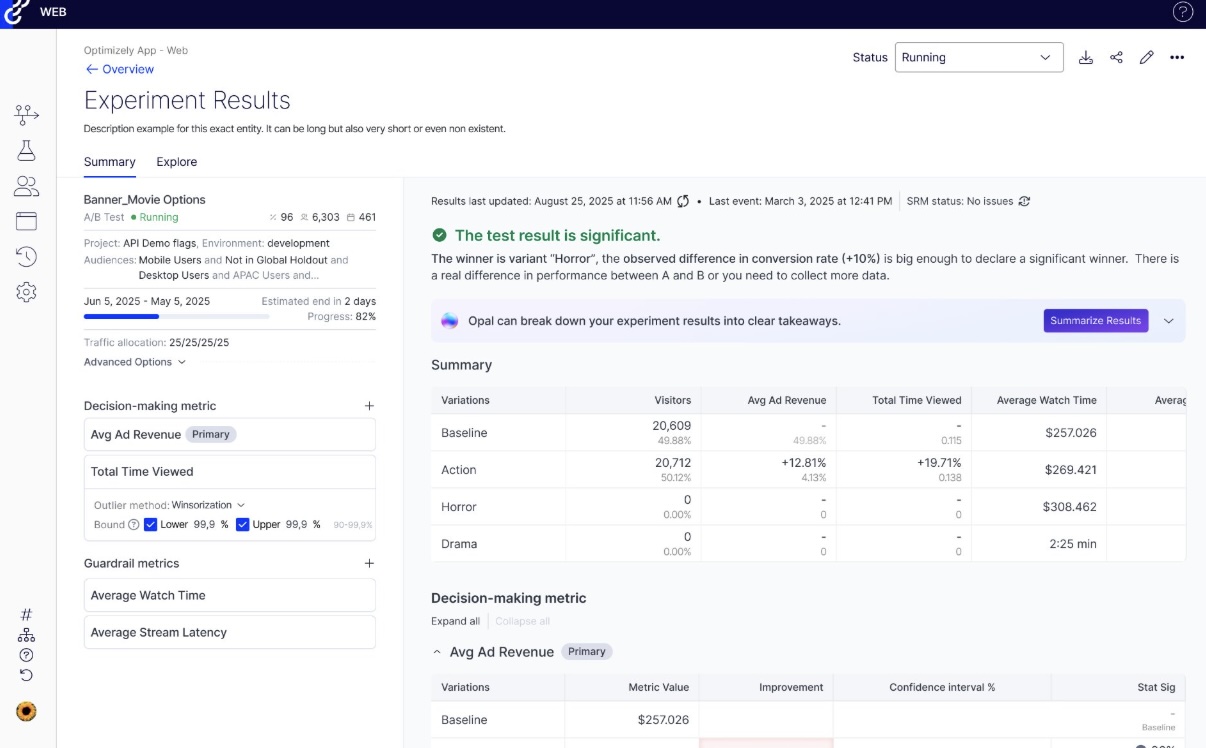
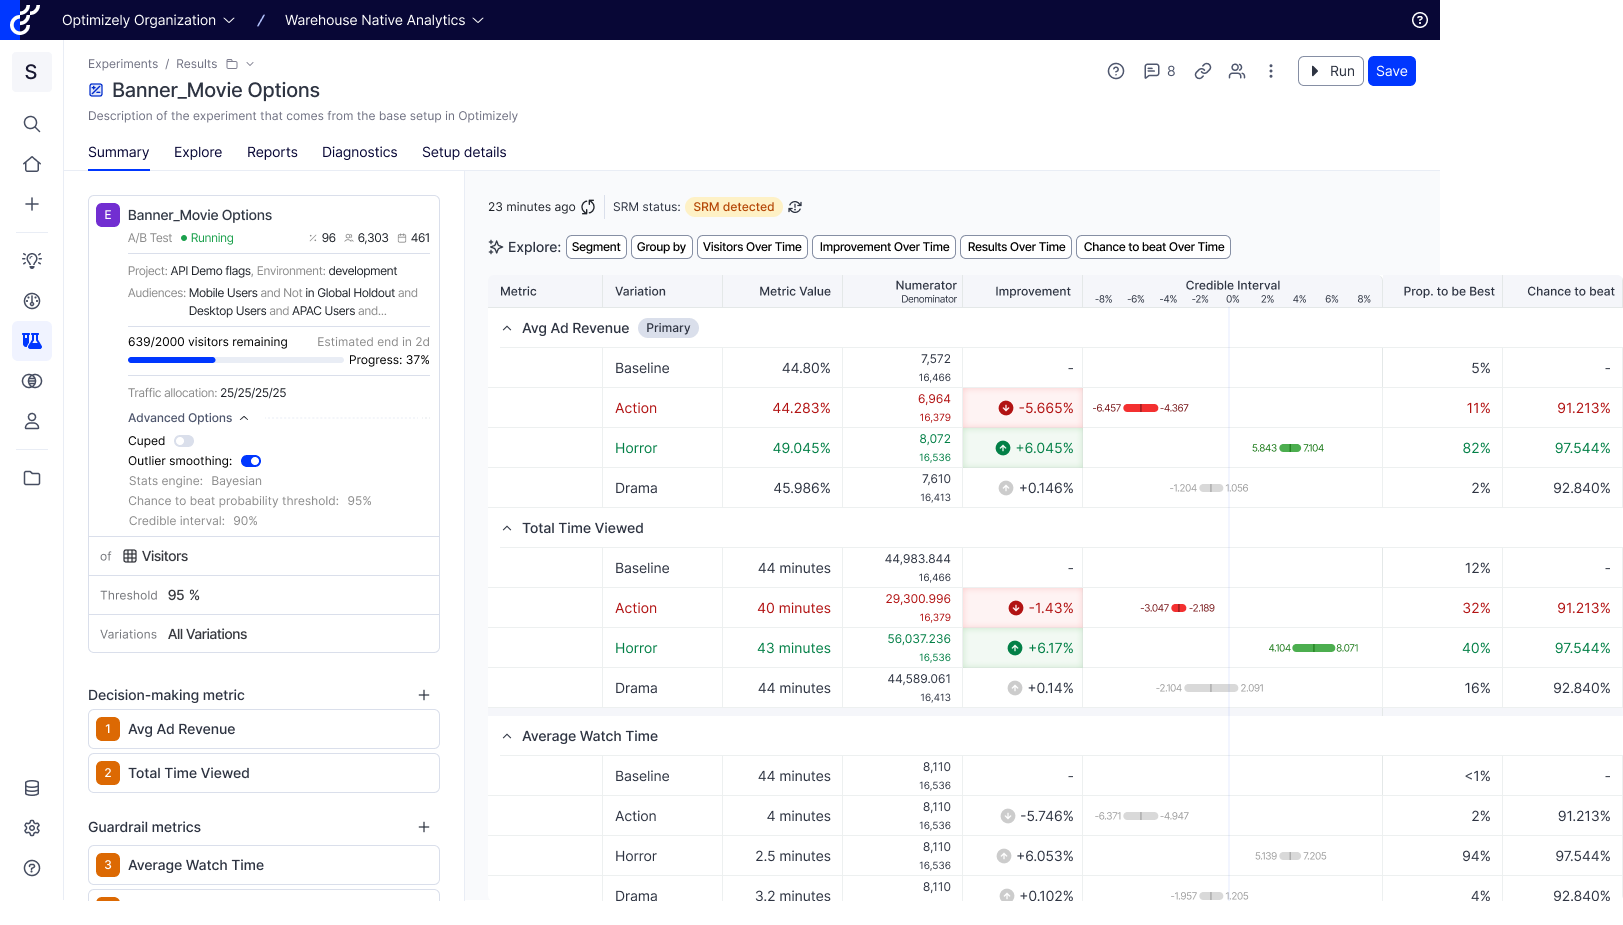
Next Generation Experimentation Analytics
Unlock deeper insights by bringing advanced analytics directly into experimentation. The new results page and expanded exploration tools from OA become available for WX and FX.
Key benefits:
-
Access richer analytics directly within experimentation workflows.
-
Use the new results page to connect test outcomes with deeper exploration tools.
-
Unify analytics and experimentation so test results become data-driven stories.
Images are for illustrative purposes and subject to change.
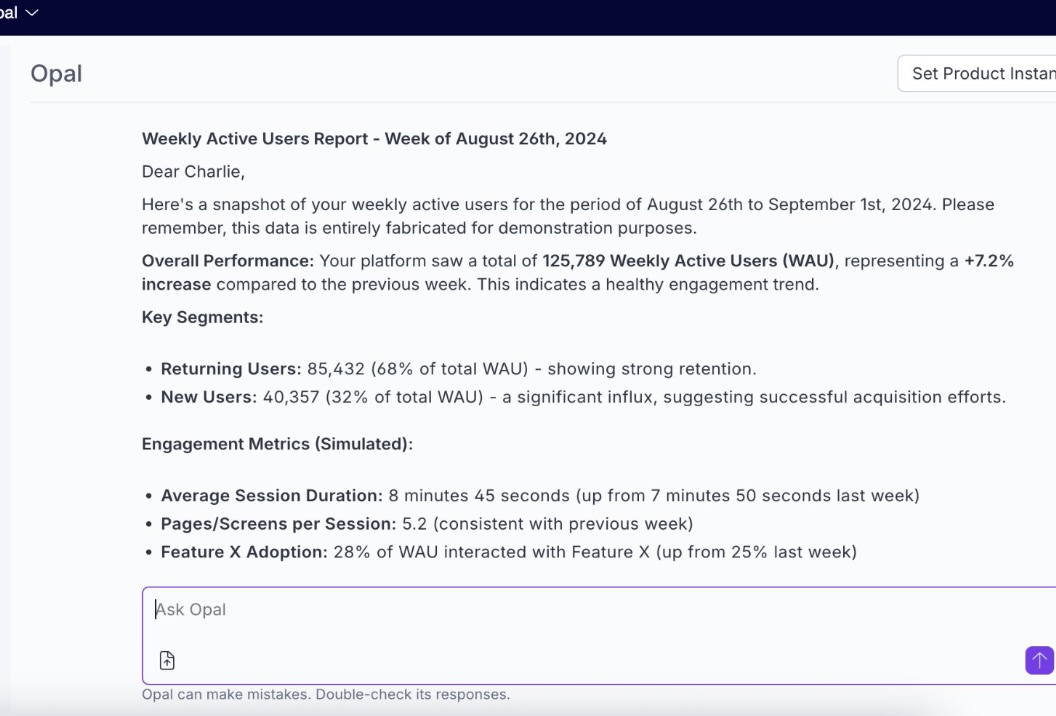
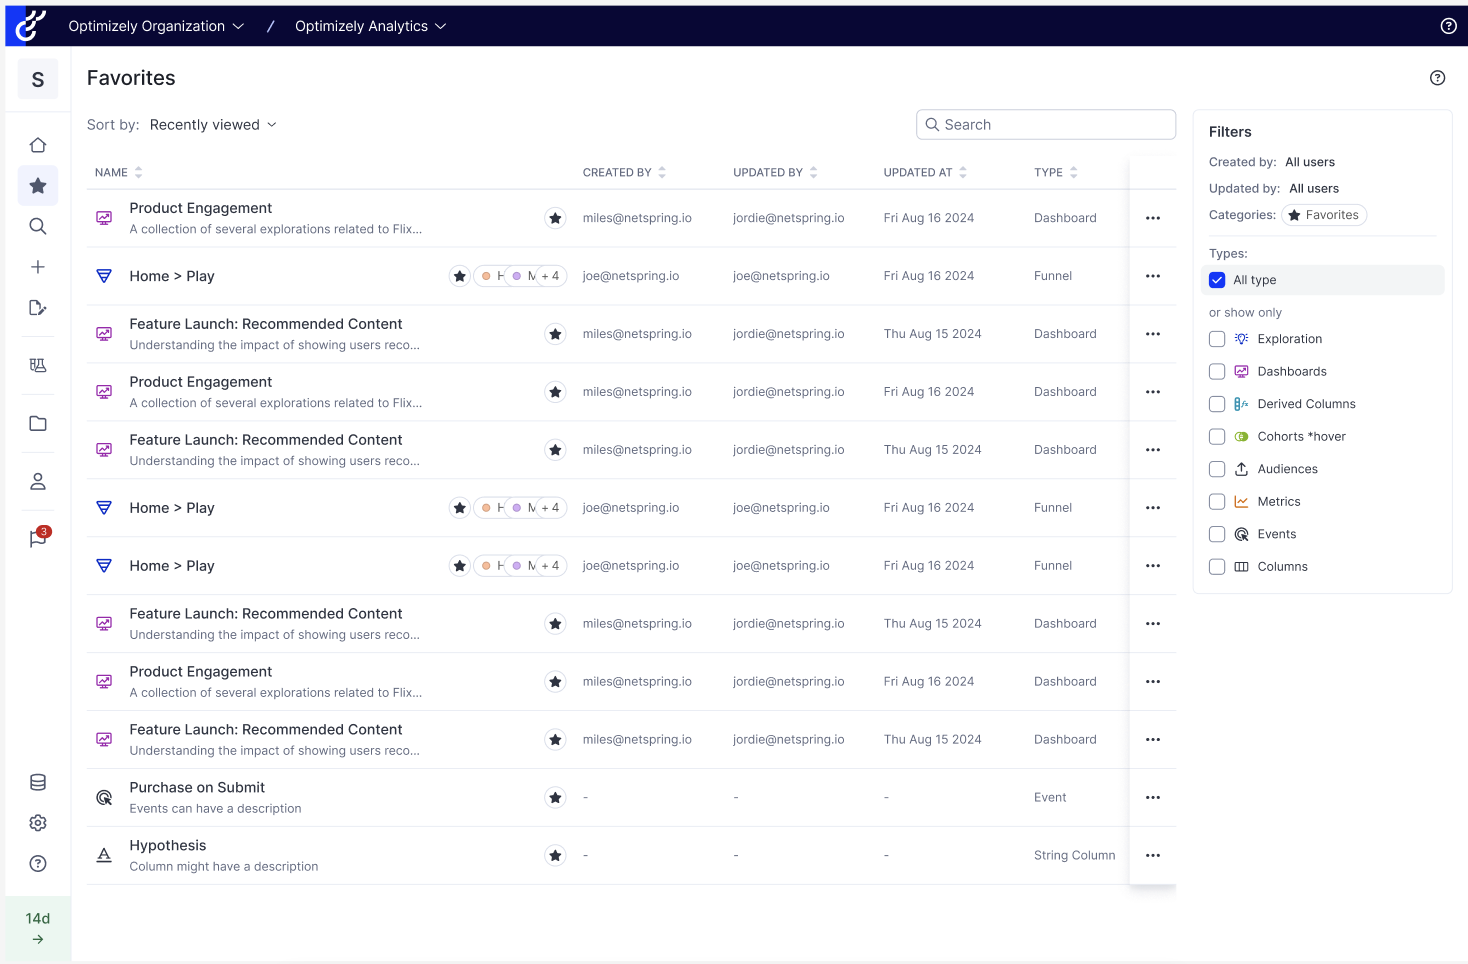
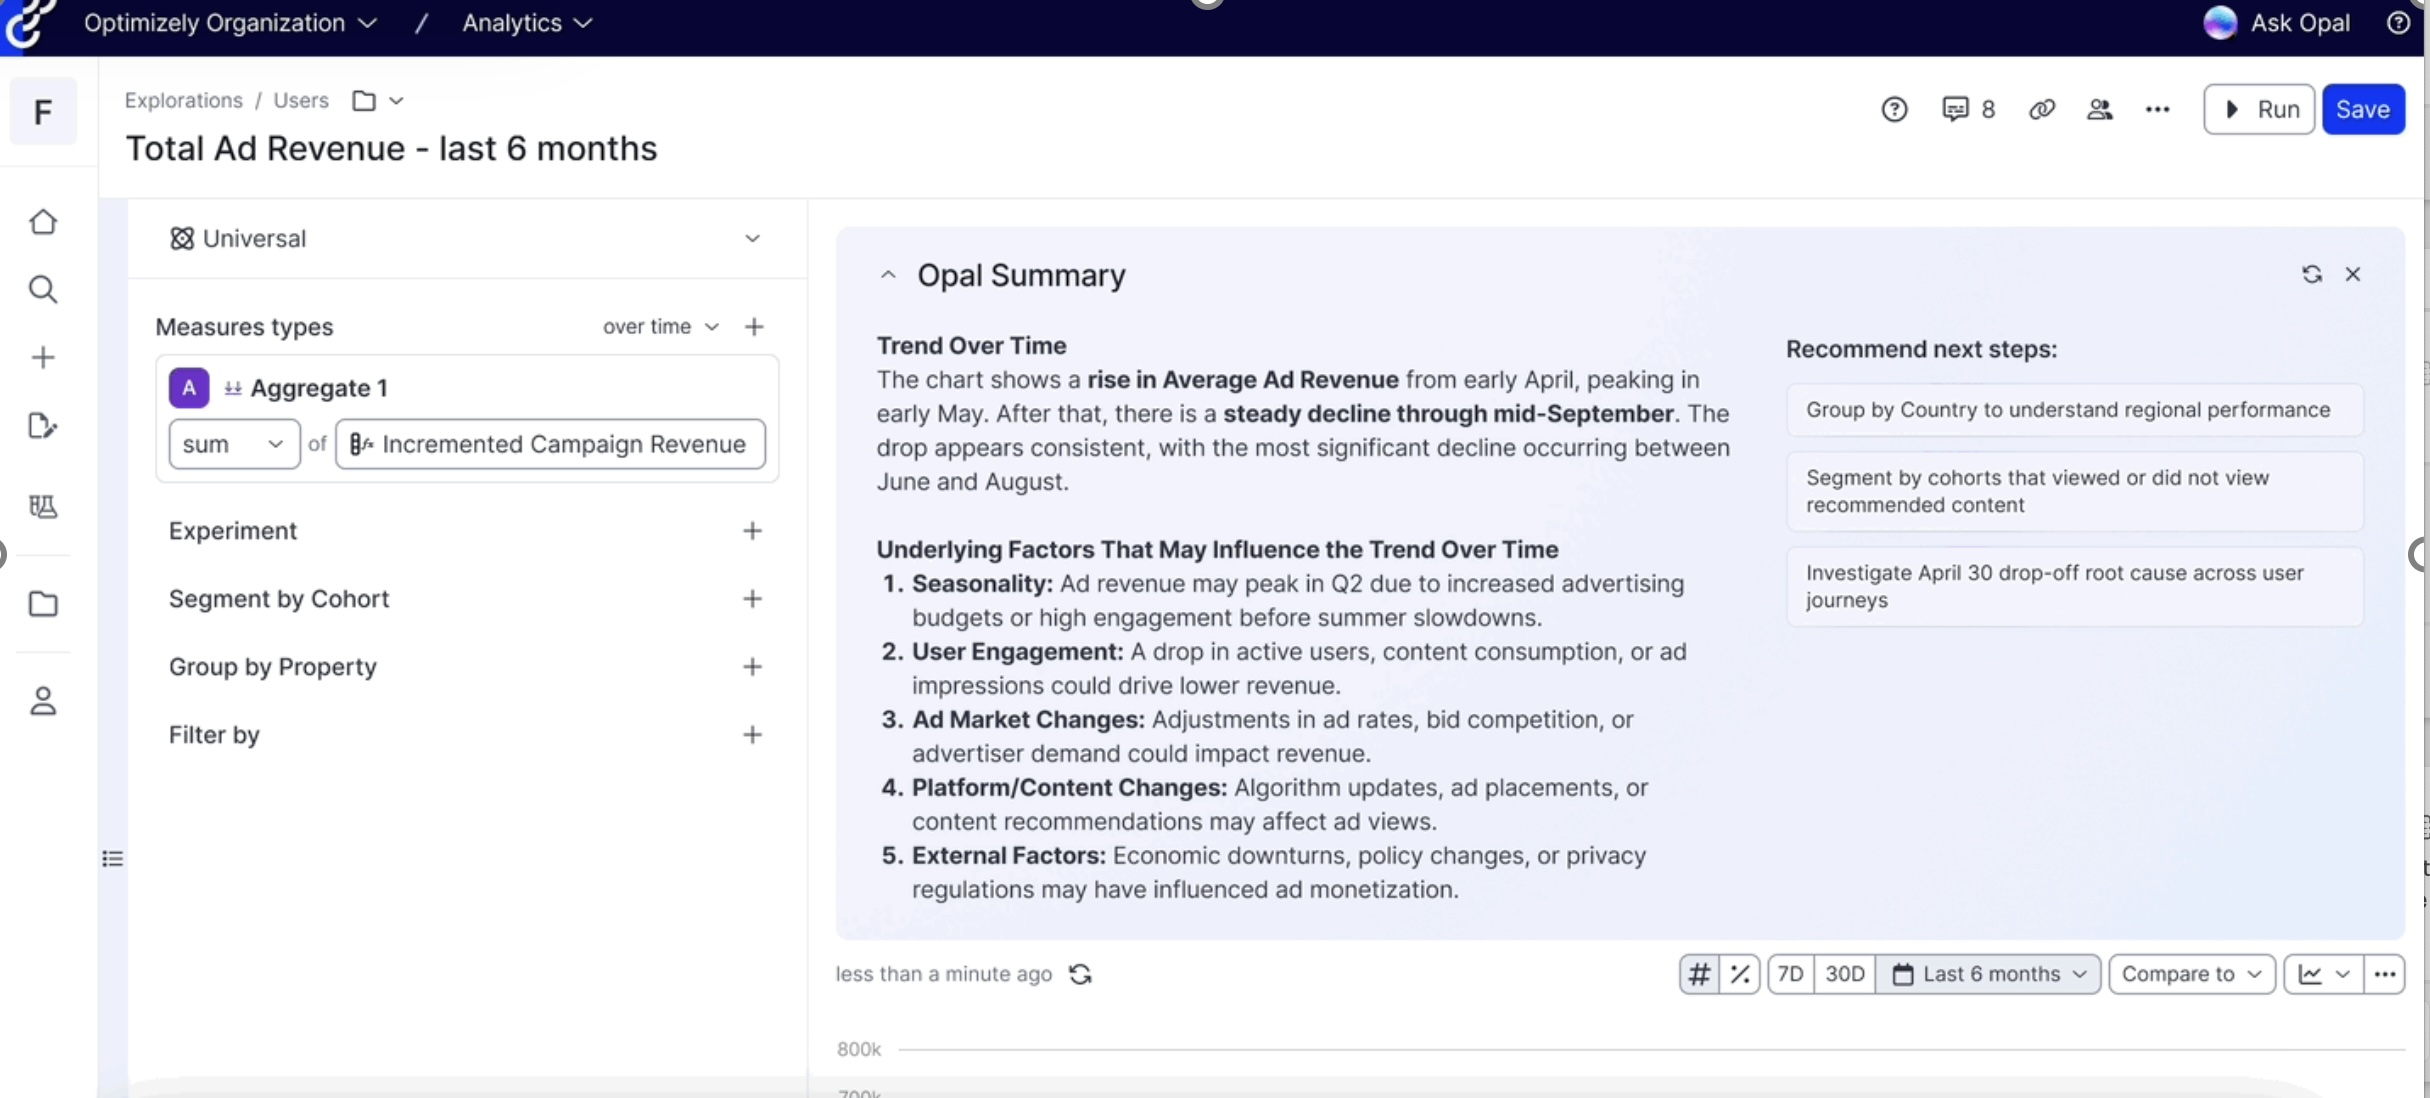
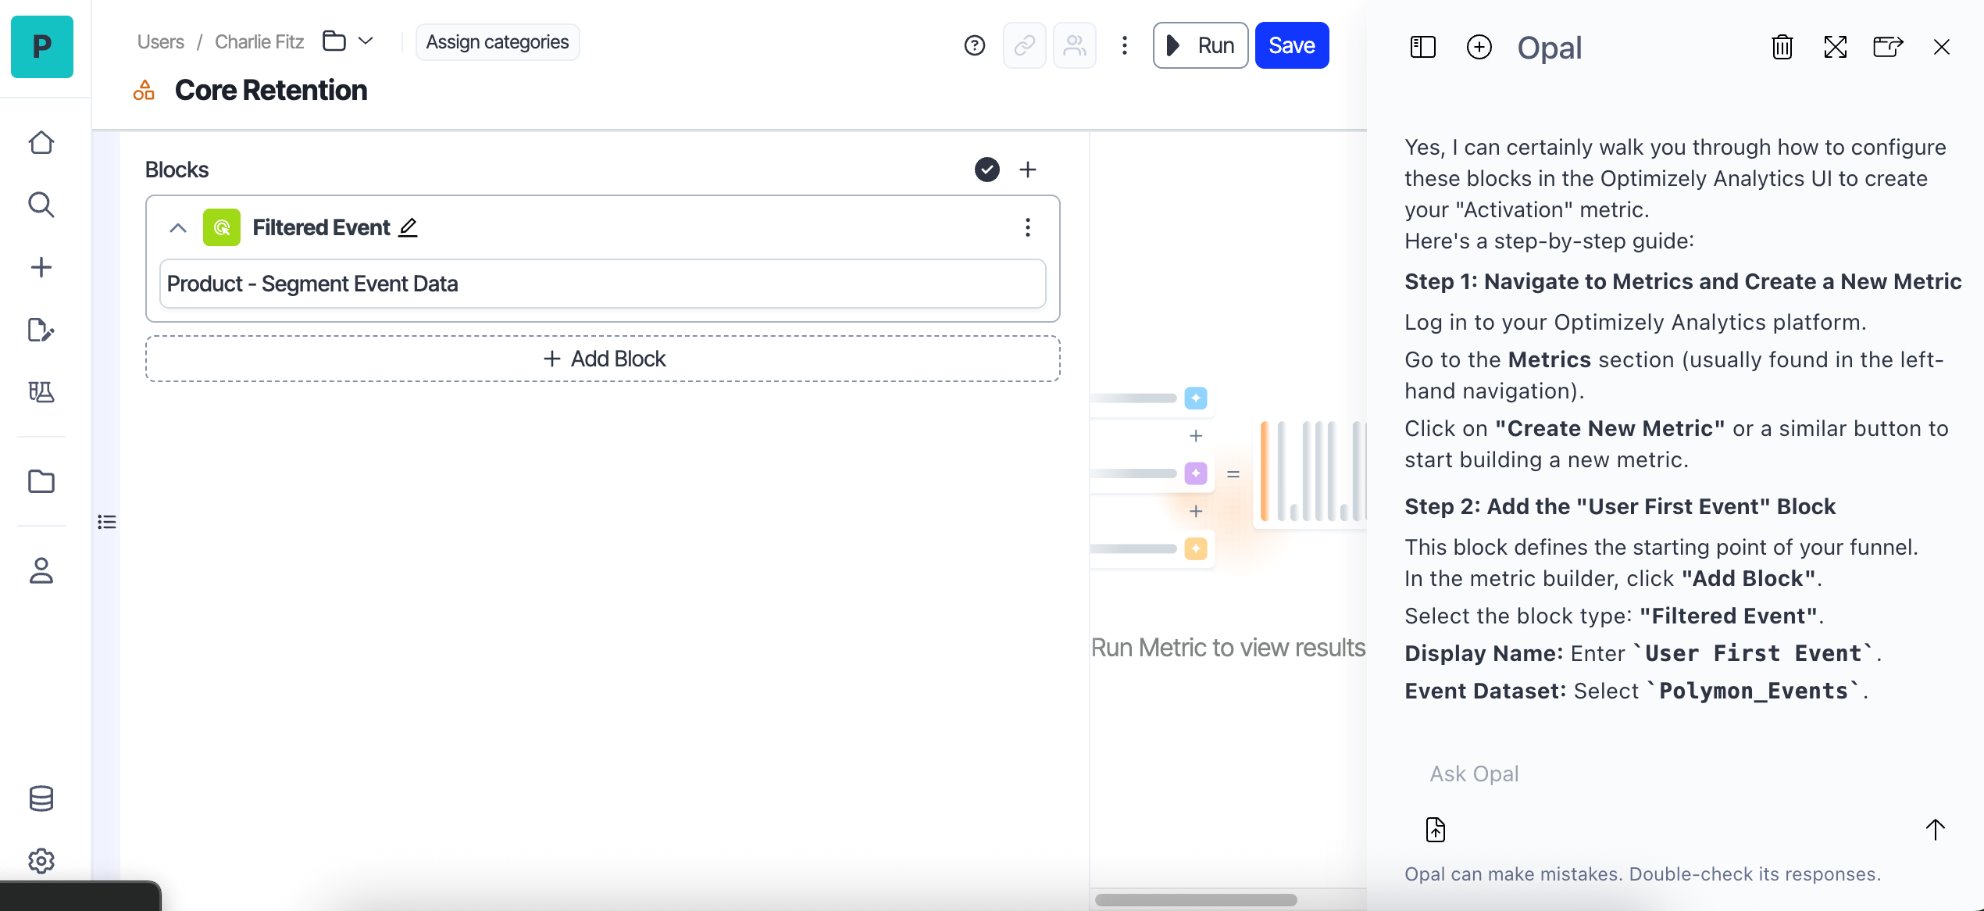
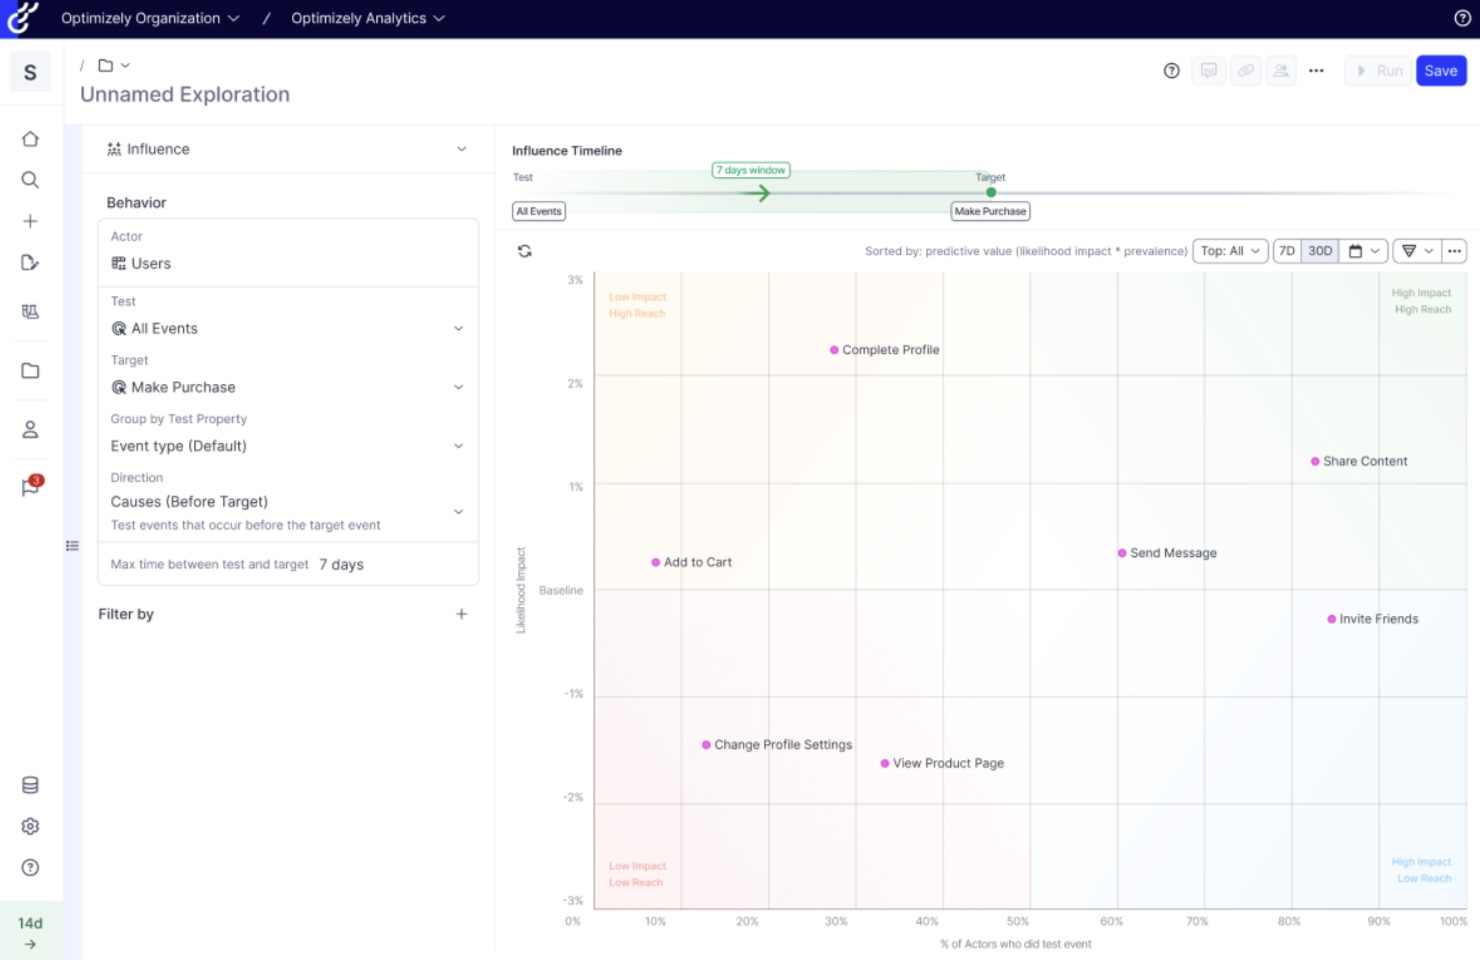
Influence Template
Instantly understand what’s driving your most important metrics — and where to focus next.
Key benefits:
-
Identify the events, cohorts, and behaviors most strongly associated with revenue, retention, and conversion.
-
Spot high-impact, high-reach actions so teams know where to invest and what to improve.
-
Explain metric changes by connecting outcome shifts to the user behaviors and segments behind them.
Images are for illustrative purposes and subject to change.
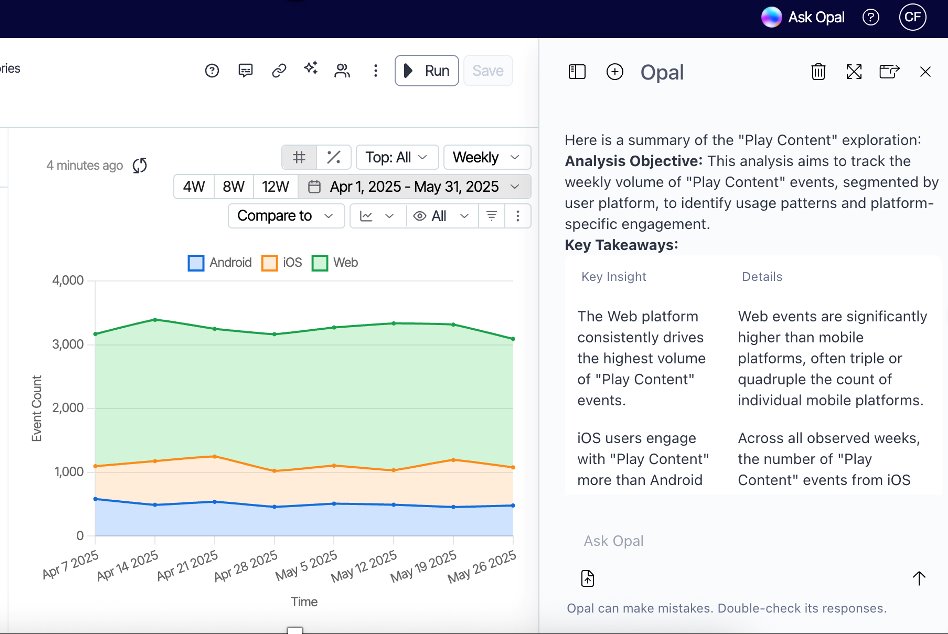
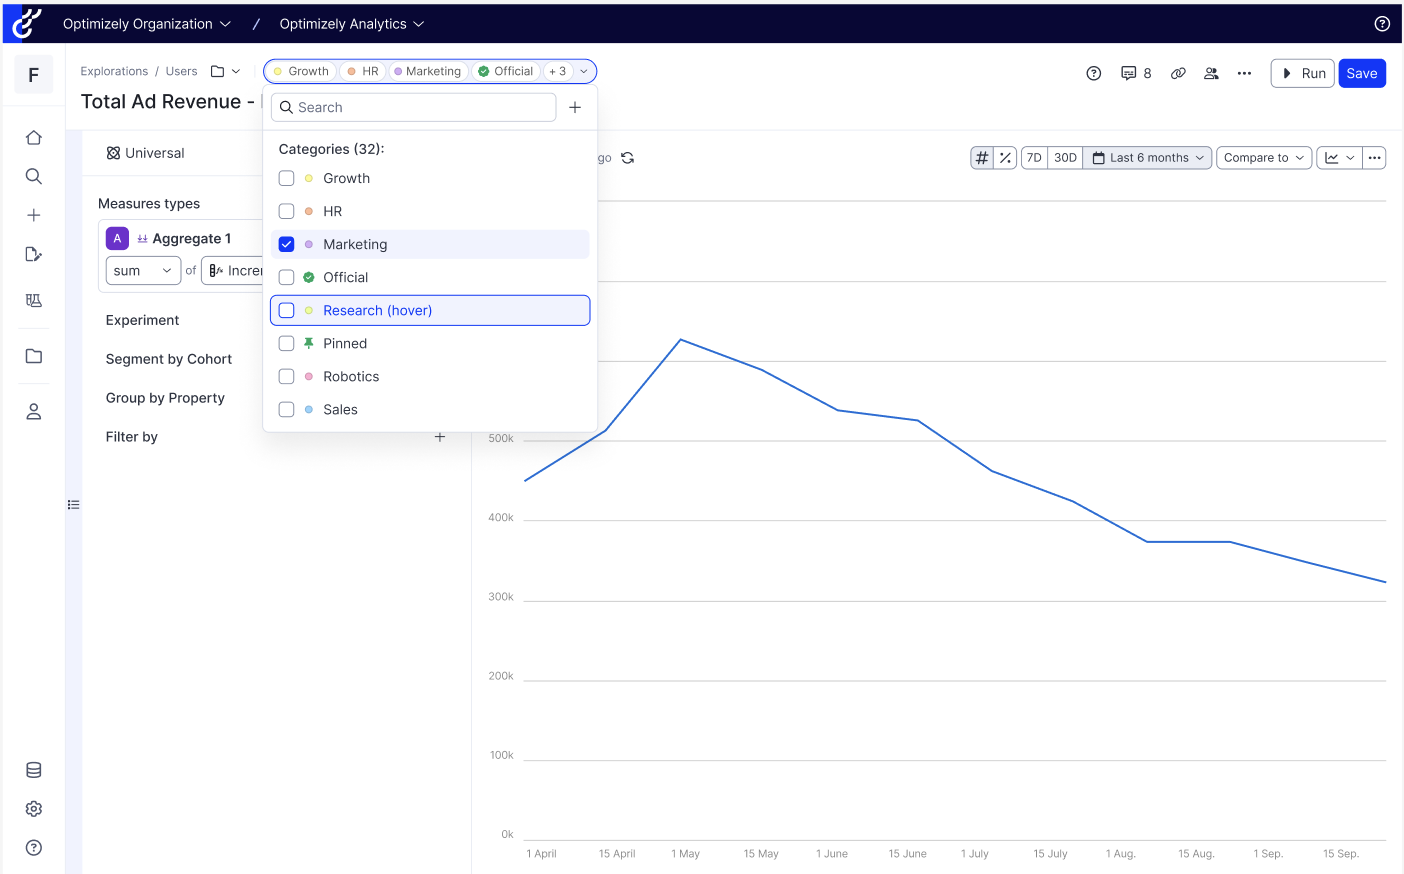
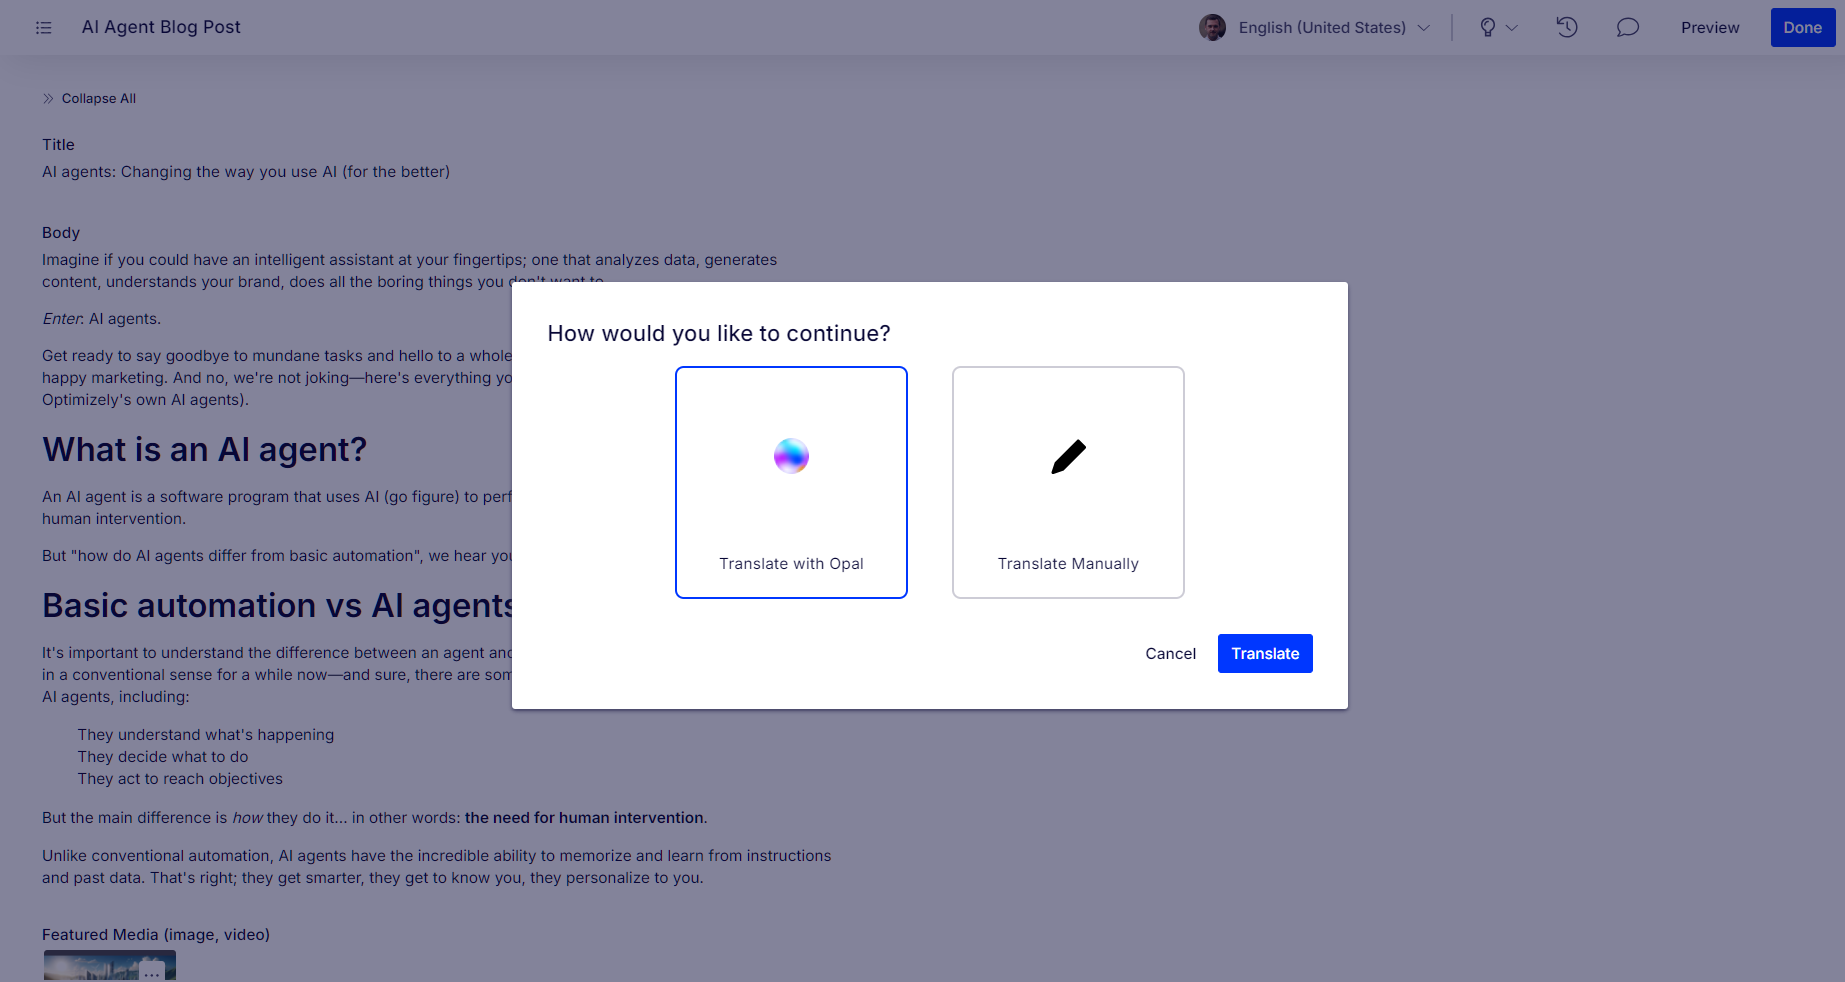
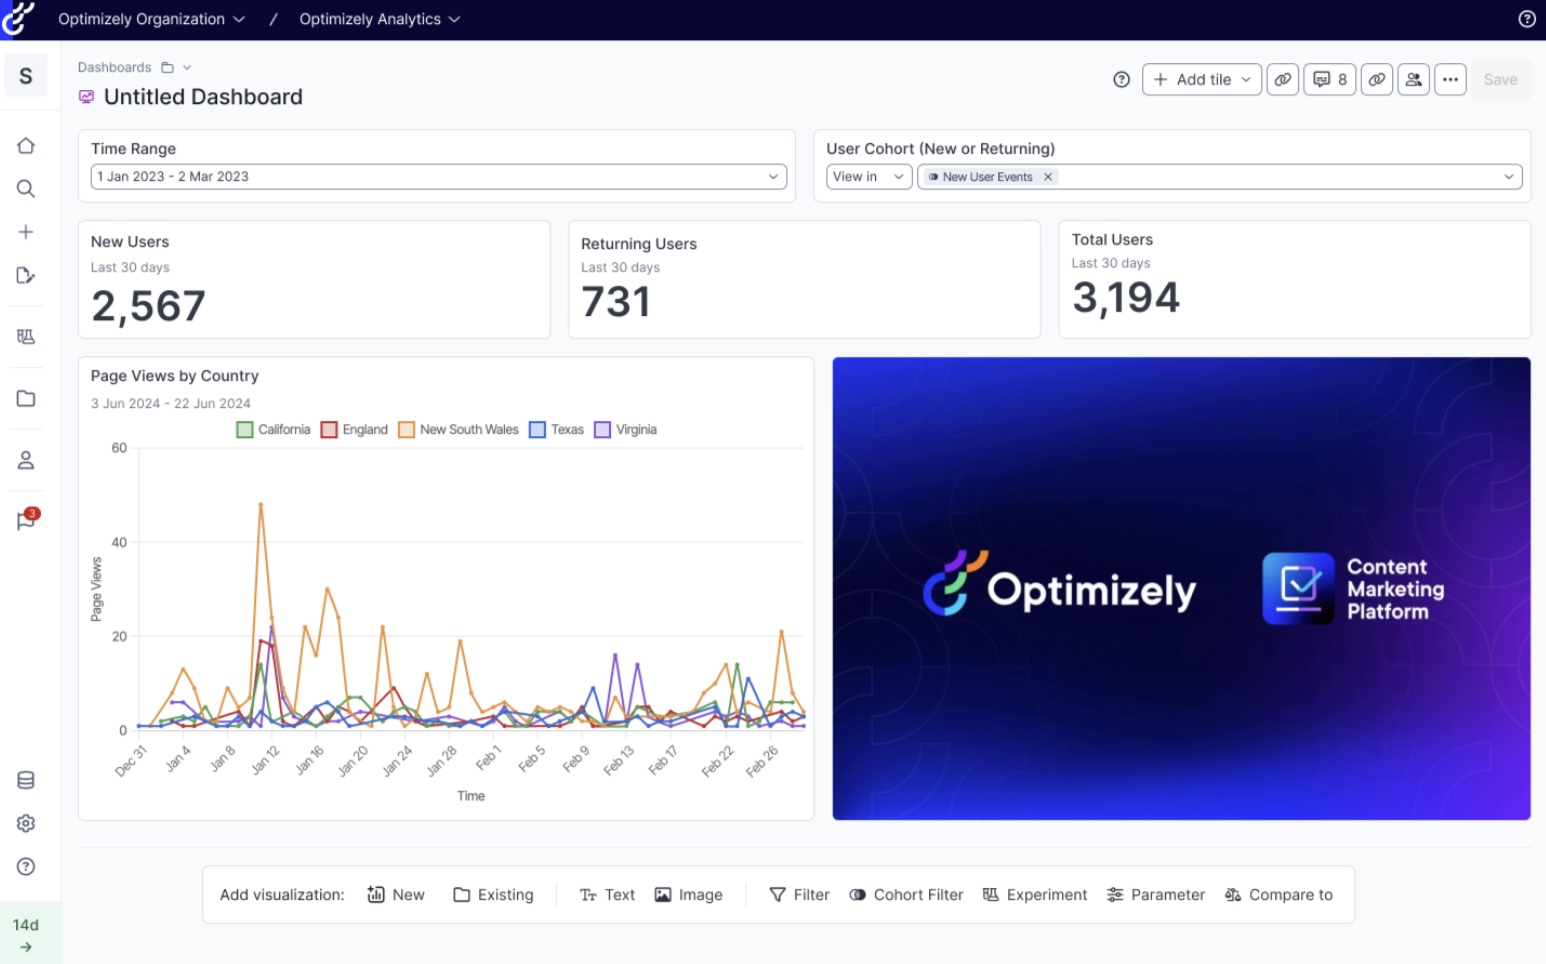
Story Tiles
Add visual context to your metrics so everyoneunderstands what changed and why it matters.
-
Attach screenshots, designs, or feature UIs directly to dashboards and experiment results.
-
Upload PNG, JPG, or GIF files to support analysis, product storytelling, and reporting.
-
Combine metrics and visuals to explain what shipped, what changed, and why it matters in one place.
Images are for illustrative purposes and subject to change.
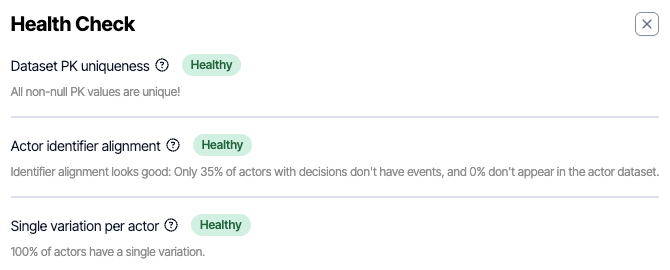
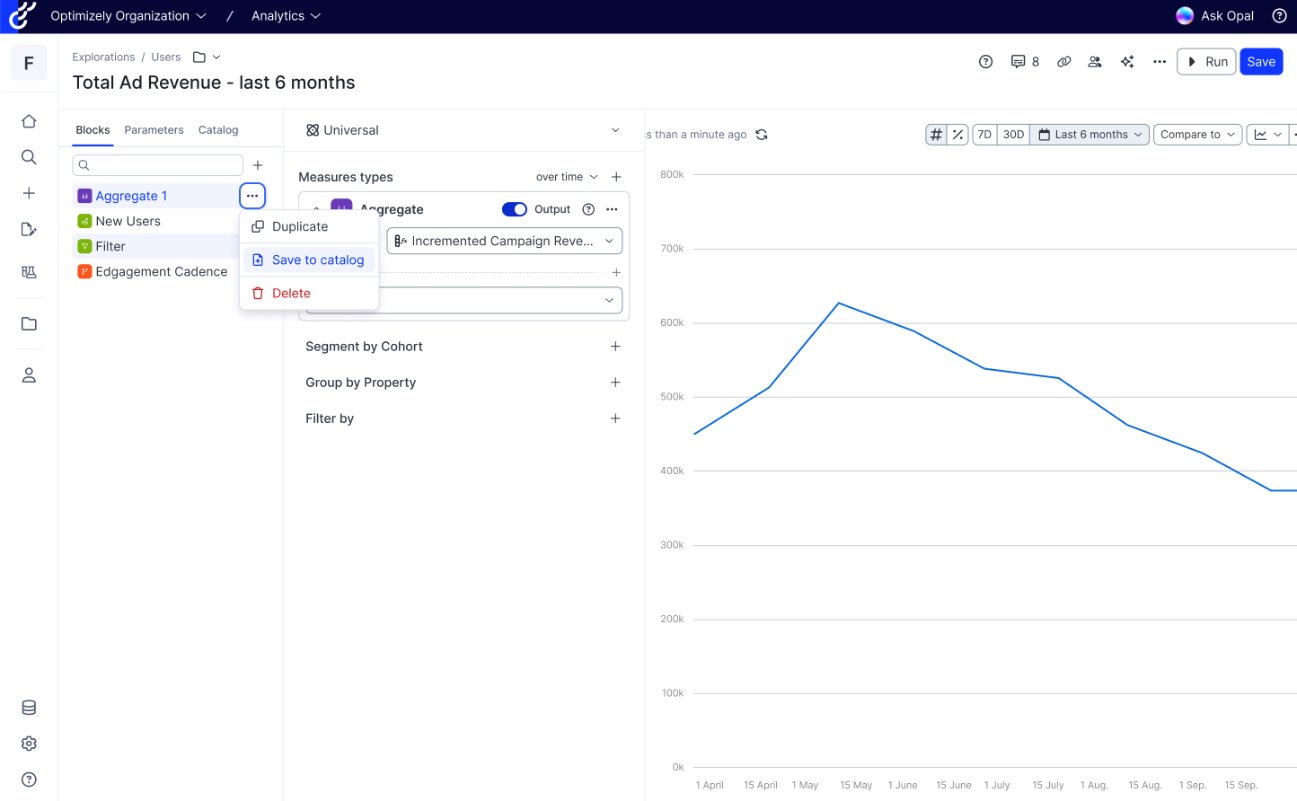
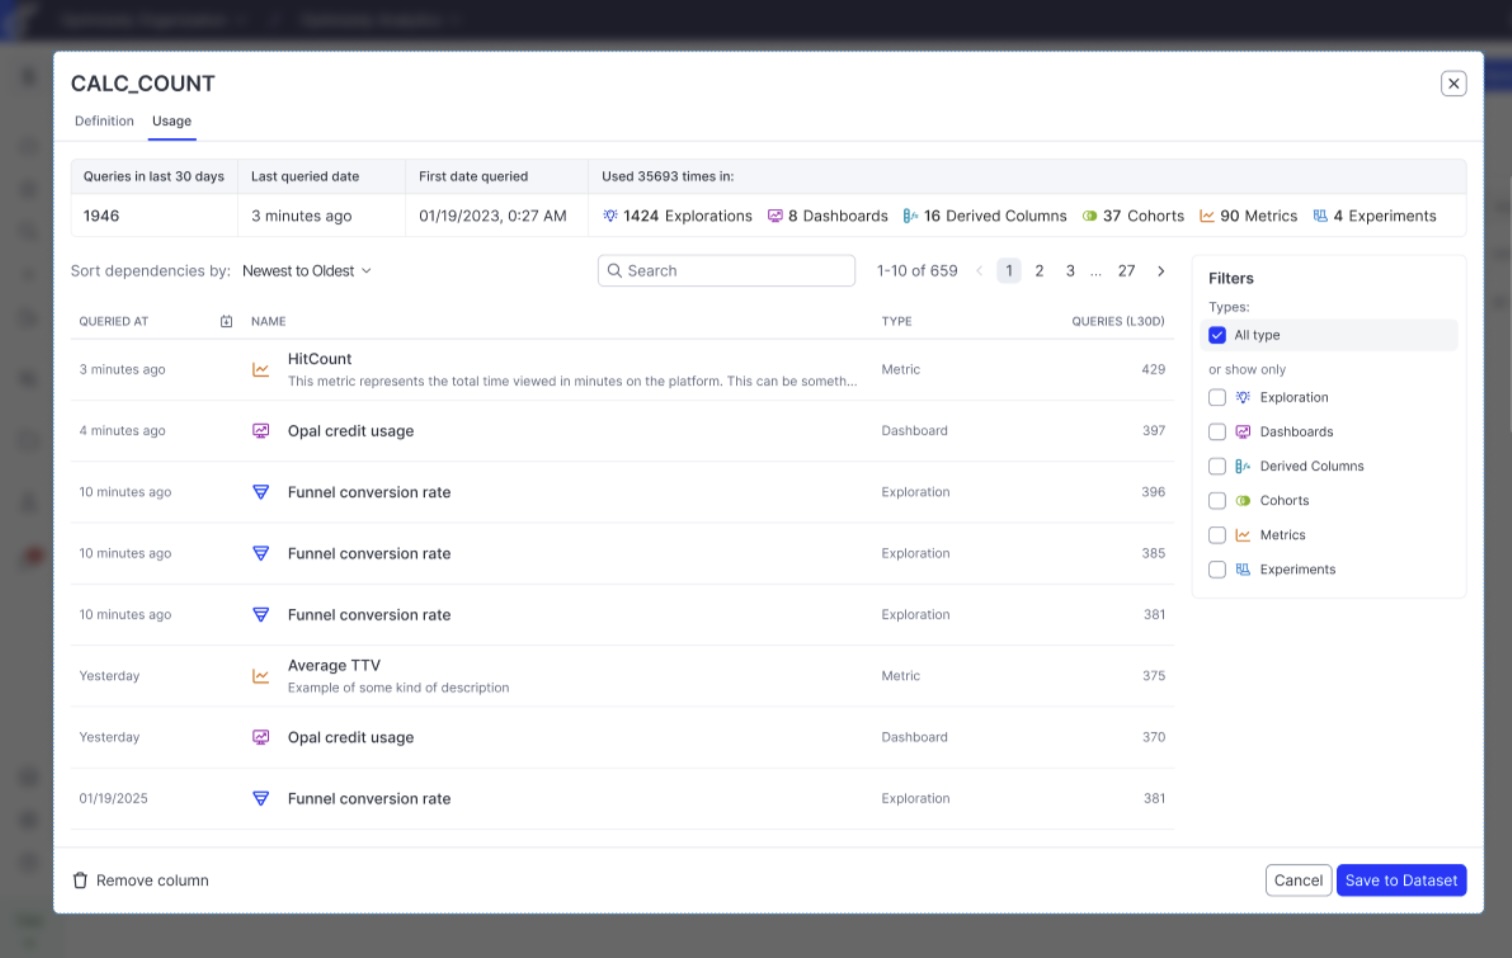
Object Dependency
Understand the downstream impact of changes.
-
See which dashboards, explorations, tiles,metrics, and cohorts depend on any columnor event before you change it.
-
Understand how frequently columns andevents are queried so you can safely cleanup, deprecate, or migrate datasets.
-
Get warned before updates that would breakdownstream analyses.
Images are for illustrative purposes and subject to change.
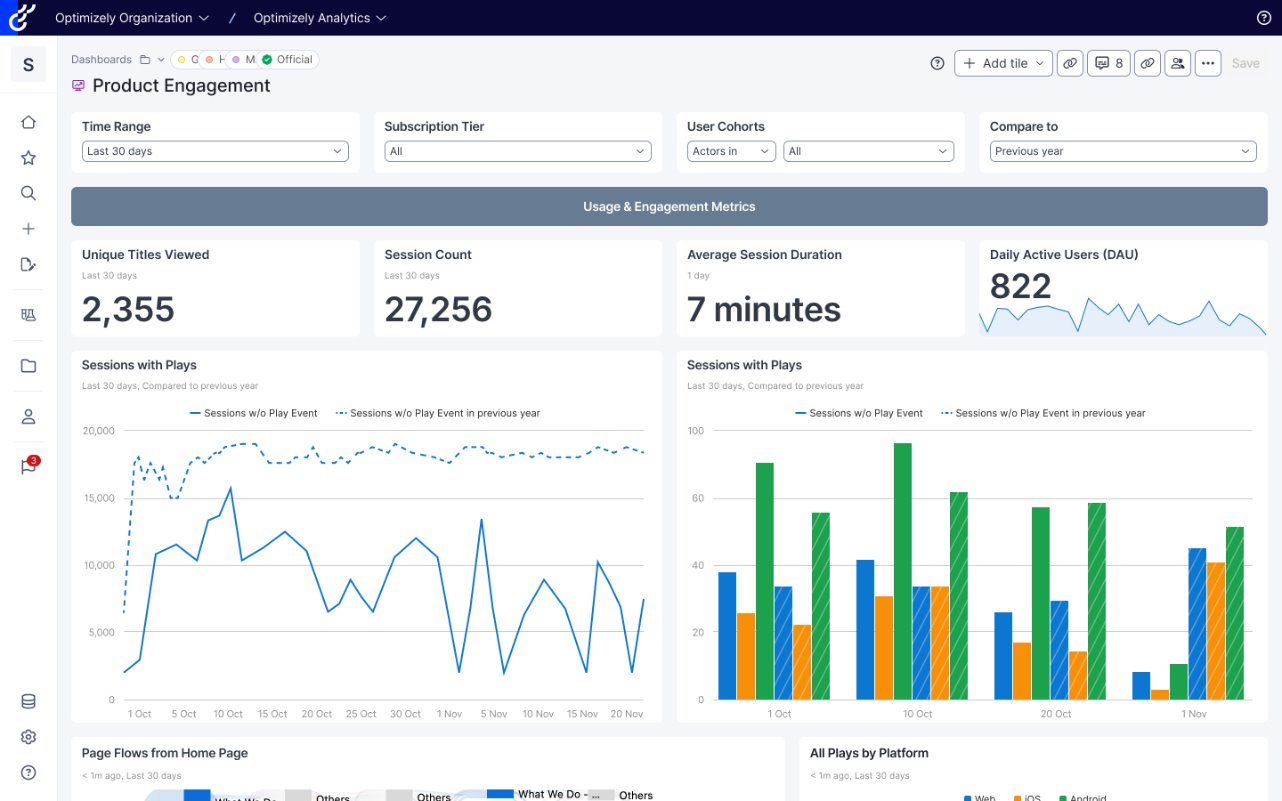
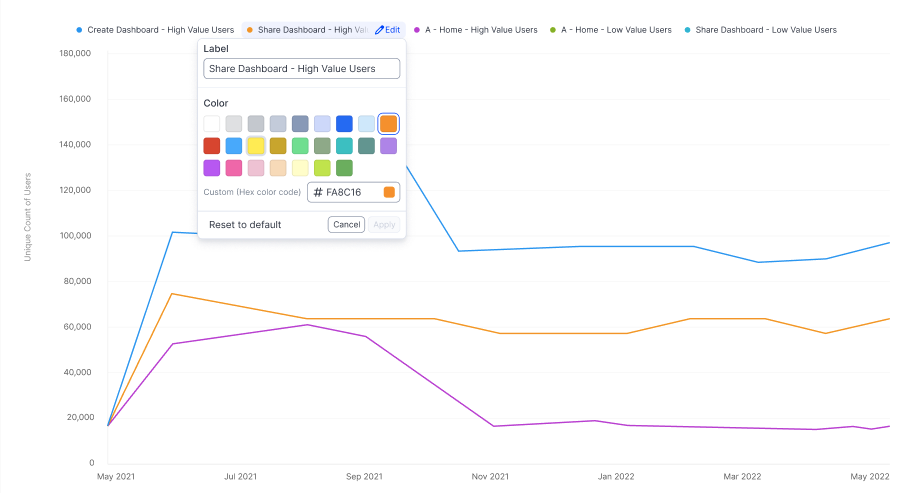
Series Color Styling
Make charts clearer and more consistent acrossdashboards and reports.
-
Customize colors and labels for each series so lines and bars are easier to read and interpret.
-
Standardize how key series (e.g., Mobile, Web, Signup Completed) appear across tiles and explorations.
-
Eliminate confusion in reviews — no more “which line is which?” when scanning dashboards.
Images are for illustrative purposes and subject to change.
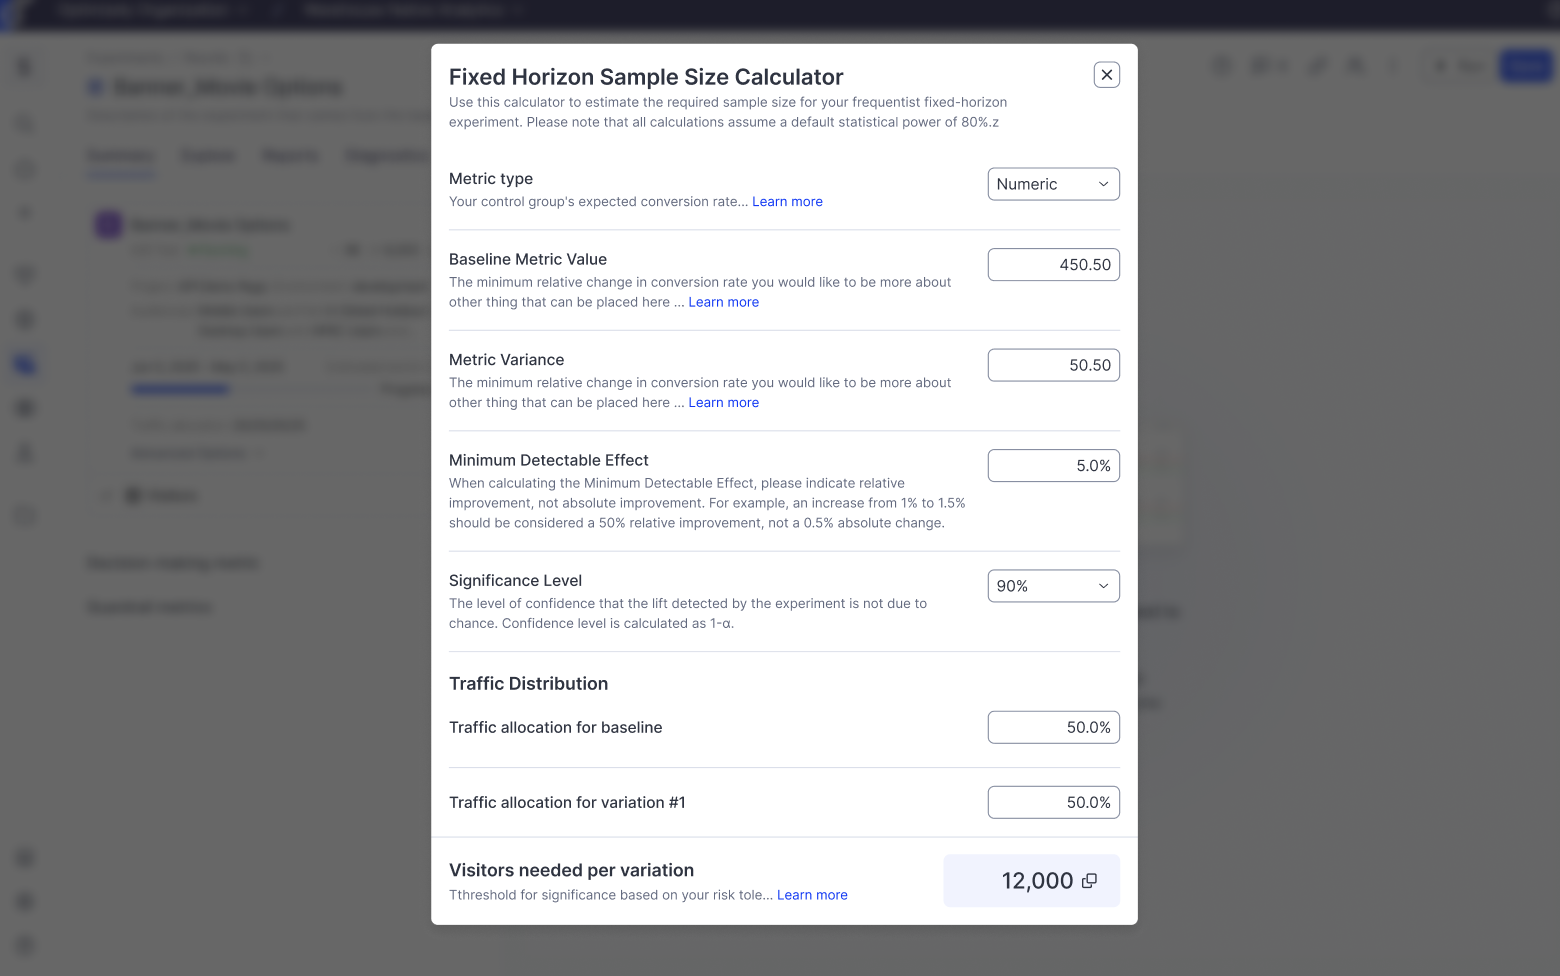
'Fixed Horizon' Stats Engine
For experiments that require a specific sample size and only allow results to be reviewed once that sample is reached, the Fixed Horizon Stats Engine provides a reliable and auditable approach. This method is ideal for teams operating in regulated environments or those with fixed-duration testing requirements.
Key benefits:
-
Ensures statistical rigor with a traditional and well-established approach.
-
Supports pre-defined test durations.
-
Enables consistent, auditable analysis.
Images are for illustrative purposes and subject to change.
Bayesian Stats Engine
The Bayesian Stats Engine interprets probability in an intuitive, decision-focused way—answering questions like “how likely is this variation to be better?” It’s ideal for teams who want faster insights, continuous monitoring, and the flexibility to incorporate prior knowledge into their analysis.
Key benefits:
-
Enables continuous monitoring without increasing false positives.
-
Presents results in a clear, probability-based format.
-
Allows integration of prior information to reach significance faster.
Images are for illustrative purposes and subject to change.