Let’s talk experimentation metrics: The new rules for scaling your program (In 2025)
There's a reason some experimentation programs scale while others stagnate.
Last month, I sat down with a VP of Digital at a Fortune 500 retailer with a familiar challenge. Their win rate? Above industry average. Their test velocity? Growing quarter over quarter. Yet in their quarterly review, the CEO asked a question that stopped them cold:
We're running more tests than ever, but why isn't this moving our bottom line?
Most experimentation programs struggle because they're:
- Celebrating surface wins (Look, the button color change worked)
- Chasing test velocity without the impact (We ran 50% more tests this quarter)
- Collecting vanity metrics (Our win rate is above the industry average)
Setting the right metrics is a constant challenge we help customers overcome, especially as they try to scale their experimentation programs.
In this blog, see:
- Which metrics actually predict program growth
- How leading programs prove massive ROI (without gaming the system)
- A practical framework for evolving your metrics as your program scales
- The hidden high-impact metrics most programs miss
Great metrics don't just count things, they tell stories that drive growth.
Common metric mistakes to avoid
Three common patterns that stop great programs from scaling:
1. The win rate obsession
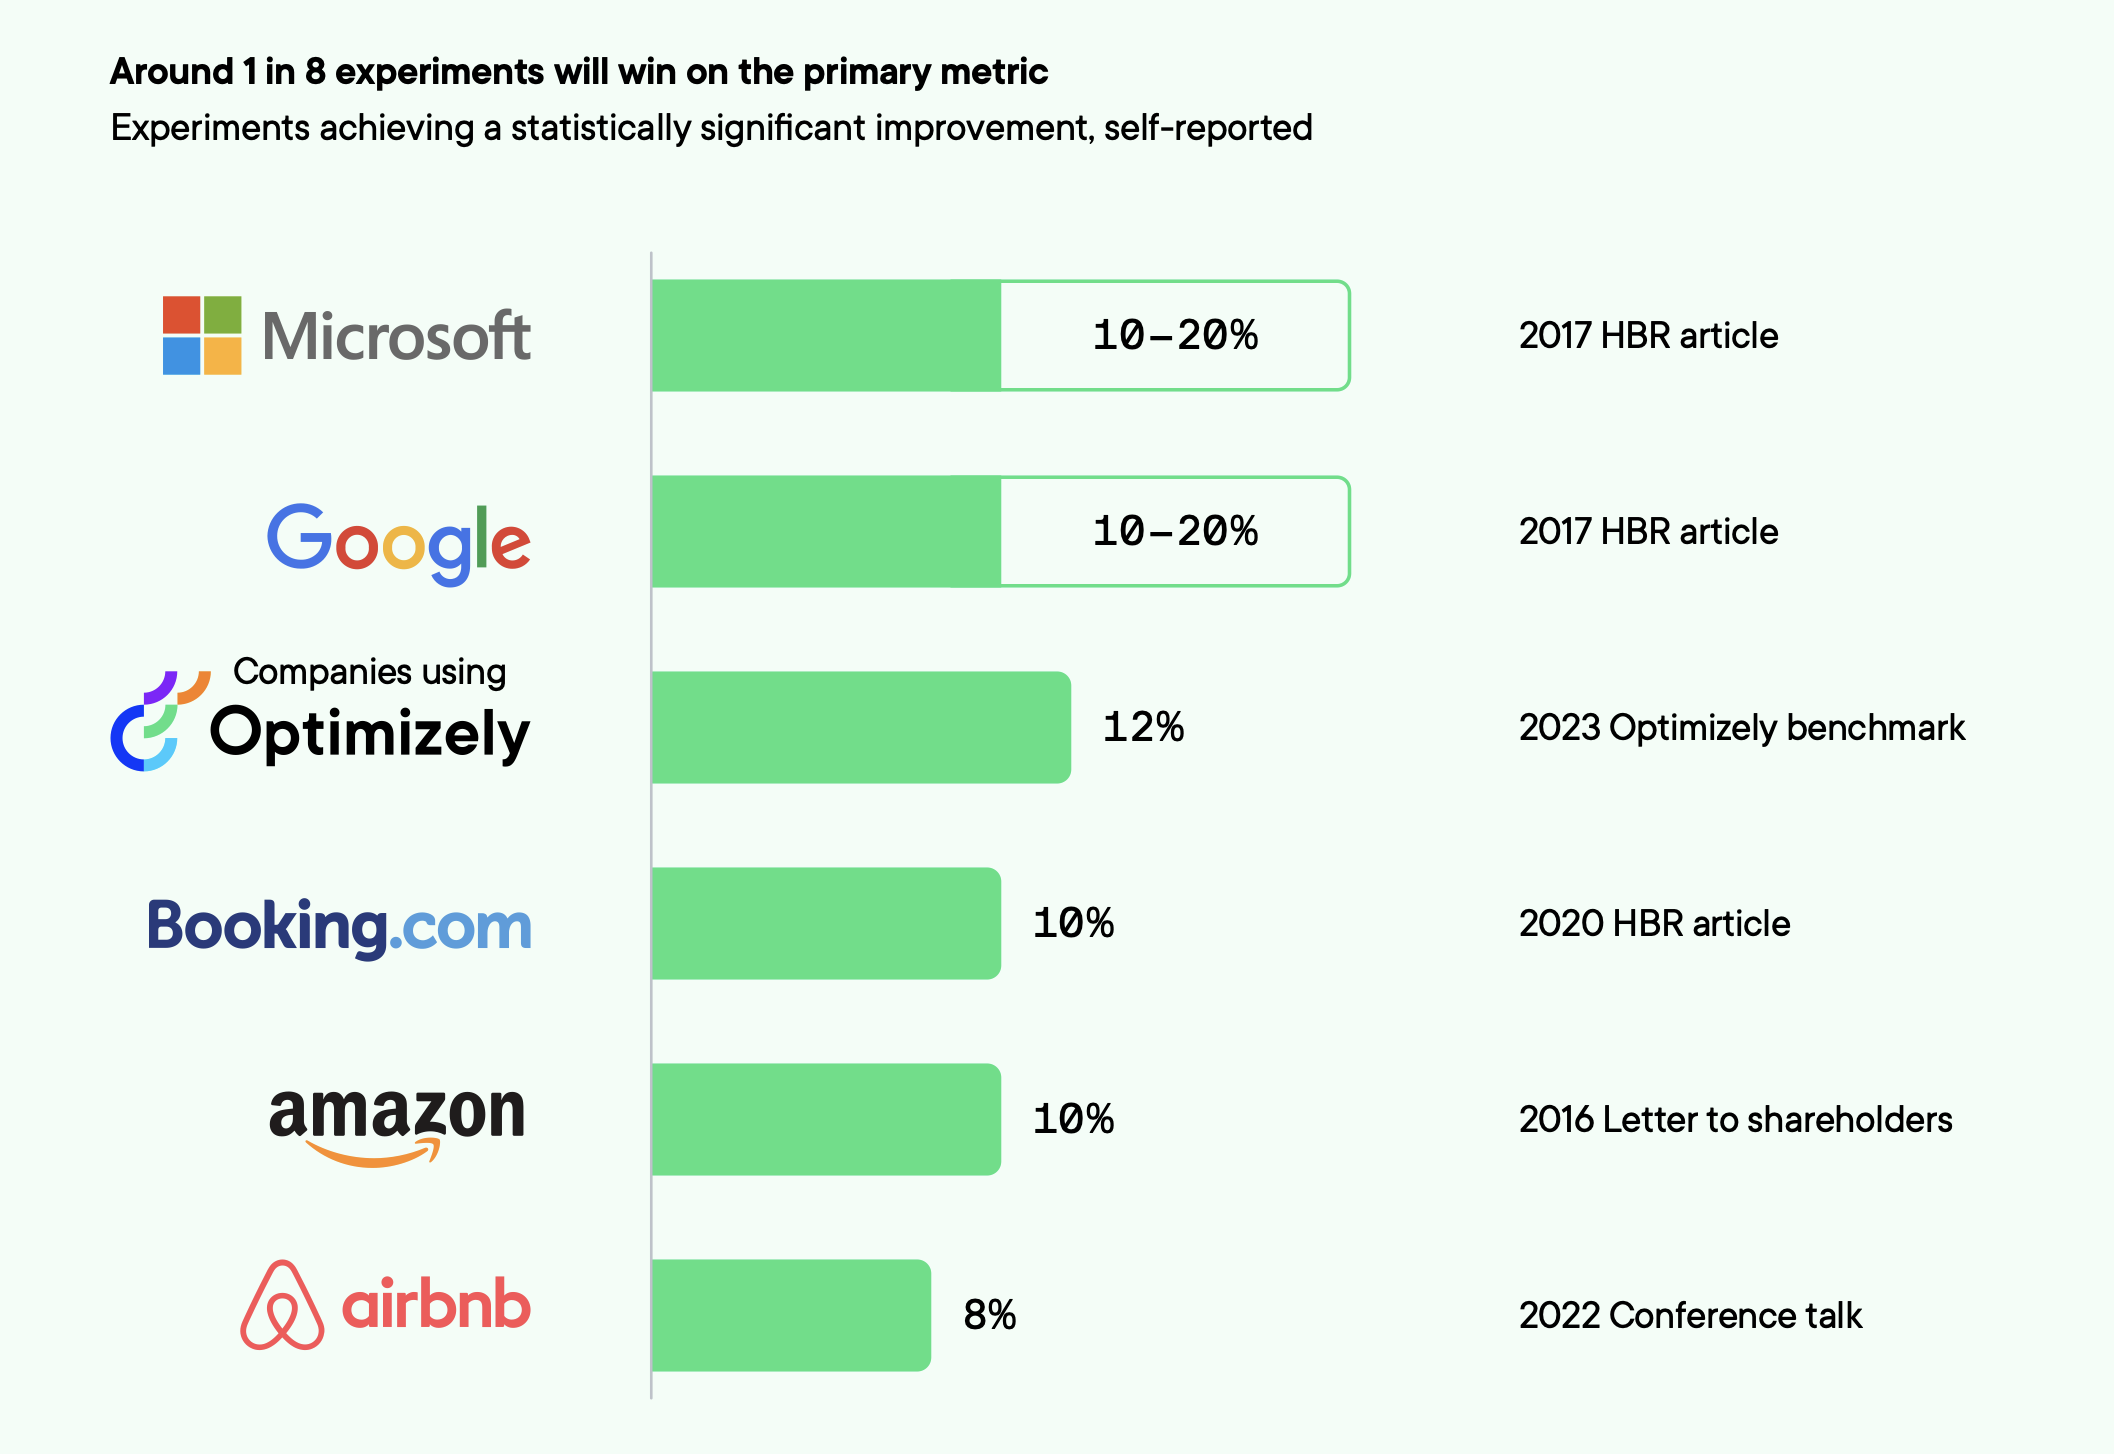
Programs often celebrate win rates, but when you dig deeper, those "wins" are mostly minor tweaks with minimal business impact. The data tells us only 12% of experiments win.

Source: Optimizely Evolution of Experimentation Report
Sure, the win rate is important - especially when you're trying to get buy-in at the beginning of your program. But to take your program to the next level of maturity, you need to move past that and start framing the value of experimentation in terms of uplift, and translating win rates into expected impact per test.
For example, would you rather have tests that win 10% of the time but deliver a million-dollar uplift? Or tests that win 50% of the time but only deliver $100 in additional revenues? (You don’t really have to answer that one.)
Every experiment delivers value - losing tests prevent harmful changes, while inconclusive results save resources from low-impact areas.
2. The velocity illusion
Test quantity alone doesn't predict program success. Most successful programs don't just run more tests, they run better ones. They:
- Test a higher number of variations simultaneously
- Shift not just to velocity but also bigger changes and impact
- Make larger code changes with more effect on the user experience
3. The surface metrics problem
Most programs track dozens of metrics but struggle to answer questions about business impact.
They're measuring everything except what matters:
- Tracking clicks but not customer journey impact
- Counting page views but not purchase intent
- Measuring surface engagement but not deep user behavior
Type of metrics
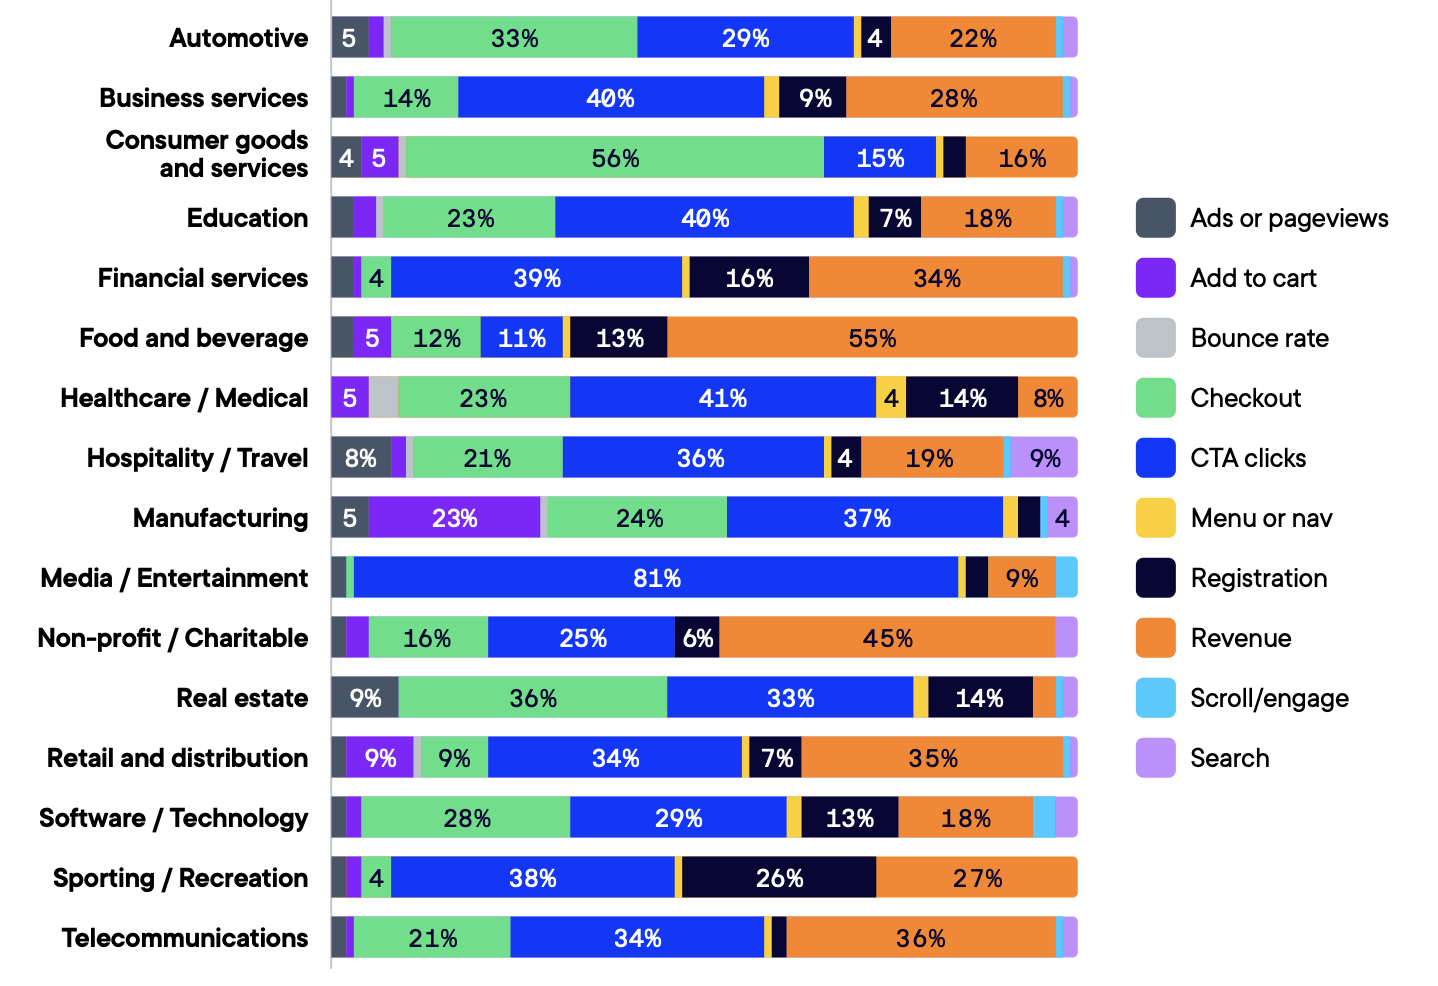
Over 90% of experiments target 5 common metrics:
- CTA Clicks
- Revenue
- Checkout
- Registration
- Add-to-cart
However, 3 of those top 5 metrics have relatively low expected impact.

Image: Metrics by impact share
It is clear that metrics with high impact are overlooked. Despite being tested only 1% of the time, search optimization shows the highest expected impact at 2.3%.
- Customers who search convert 2-3x more than browsers
- Search patterns reveal immediate revenue opportunities
- Zero-result searches highlight product gaps
Journey metrics
Another way to scale your experimentation program is to measure entire customer journeys rather than focusing on individual page metrics.
Think about your own product journey. A customer rarely makes a decision based on a single page or feature. They move through a series of interactions, each building on the last. Yet most programs still optimize these touchpoints in isolation.
A major SaaS company we work with recently shifted from solely optimizing its pricing page conversion rate to measuring its entire consideration journey. Their "winning" pricing page test was actually creating friction further down the funnel. By switching to journey-based measurement, they increased their conversion rate.
Key journey metrics to consider:
- Cross-page interaction patterns that reveal how users actually navigate your product
- Abandon points in complex flows, especially multi-step processes like checkout or onboarding
- Return visitor behavior changes that signal long-term engagement impact
- Multi-touchpoint attribution to understand which combinations drive conversion
Compound metrics
You can also combine metrics in unexpected ways. Instead of looking at the cart abandonment rate in isolation, you can combine it with customer lifetime value data. Potential customers often compare options before making biggercommitments.
Here are examples of compound metrics to drive more impact:
- Customer acquisition cost paired with lifetime value reveals the true ROI of experimentation.
- Feature adoption combined with retention metrics shows which product changes stick.
- Price sensitivity analyzed alongside purchase frequency identifies your most valuable optimization opportunities.
Remember, primary metrics vary by industry, due to differences in goals, priorities, and tracking capabilities

Source: Optimizely Evolution of Experimentation Report
More tests = more value. Even data says that’s not true.
Is it really as simple as more tests = more value?
When you’re getting your program up and running, say the first 12-18 months, yes - run as many tests as possible. That’ll help you build a data bank of successful stories with the aim of winning more resources and establishing a culture of experimentation.
However, moving to the next level is not necessarily about increasing velocity. It’s about focusing on complexity and moving beyond cosmetic changes. Minute tweaks tend to result in minute uplifts. Our research showed us that the highest uplift experiments share two things in common:
- They make larger code changes with more effect on the user experience.
- They test a higher number of variations simultaneously.
More complex experiments that make major changes to the user experience e.g. pricing, discounts, checkout flow, data collection, etc. are more likely to generate higher uplifts.
The role of analytics
To track journey metrics and create compound metrics, you need your data to work together. But most experimentation programs face a fundamental obstacle as their data lives in silos. Web analytics in one place, customer data in another, and experimentation results somewhere else entirely.
This is where warehouse-native analytics changes the game.
- Test against any metric in your warehouse, from revenue to lifetime value, without complex data pipelines.
- Answer sophisticated business questions in minutes, not days. Generate cohort insights on the fly.
- Run experiments across the web, email, and CRM using Stats Engine, all analyzed in one place.
- Keep sensitive data in your warehouse while running sophisticated experiments.
- End metric debates with everyone working from the same warehouse data.
See why warehouse-native analytics is the present and future of data-driven experimentation.
Also, your analytics capabilities should go beyond just consolidating data. The list includes:
- Heatmapping: Move beyond basic click tracking to understand how user interactions translate to revenue across your entire customer journey.
- Custom events: Break free from predefined events and track any user behavior that matters to your business, including complex interaction sequences and multi-step conversion paths.
- Multi-touchpoint attribution: Understand how experiments impact the entire customer journey, tracking cross-device paths and measuring delayed conversion impact.
- Statistical Significance: Run sophisticated analyses without sacrificing speed, leveraging automated testing and sequential analysis to drive faster, more accurate decisions.
These capabilities will turn your analytics engine from a passive reporting system to an active insight generator.
How to select metrics at different program stages
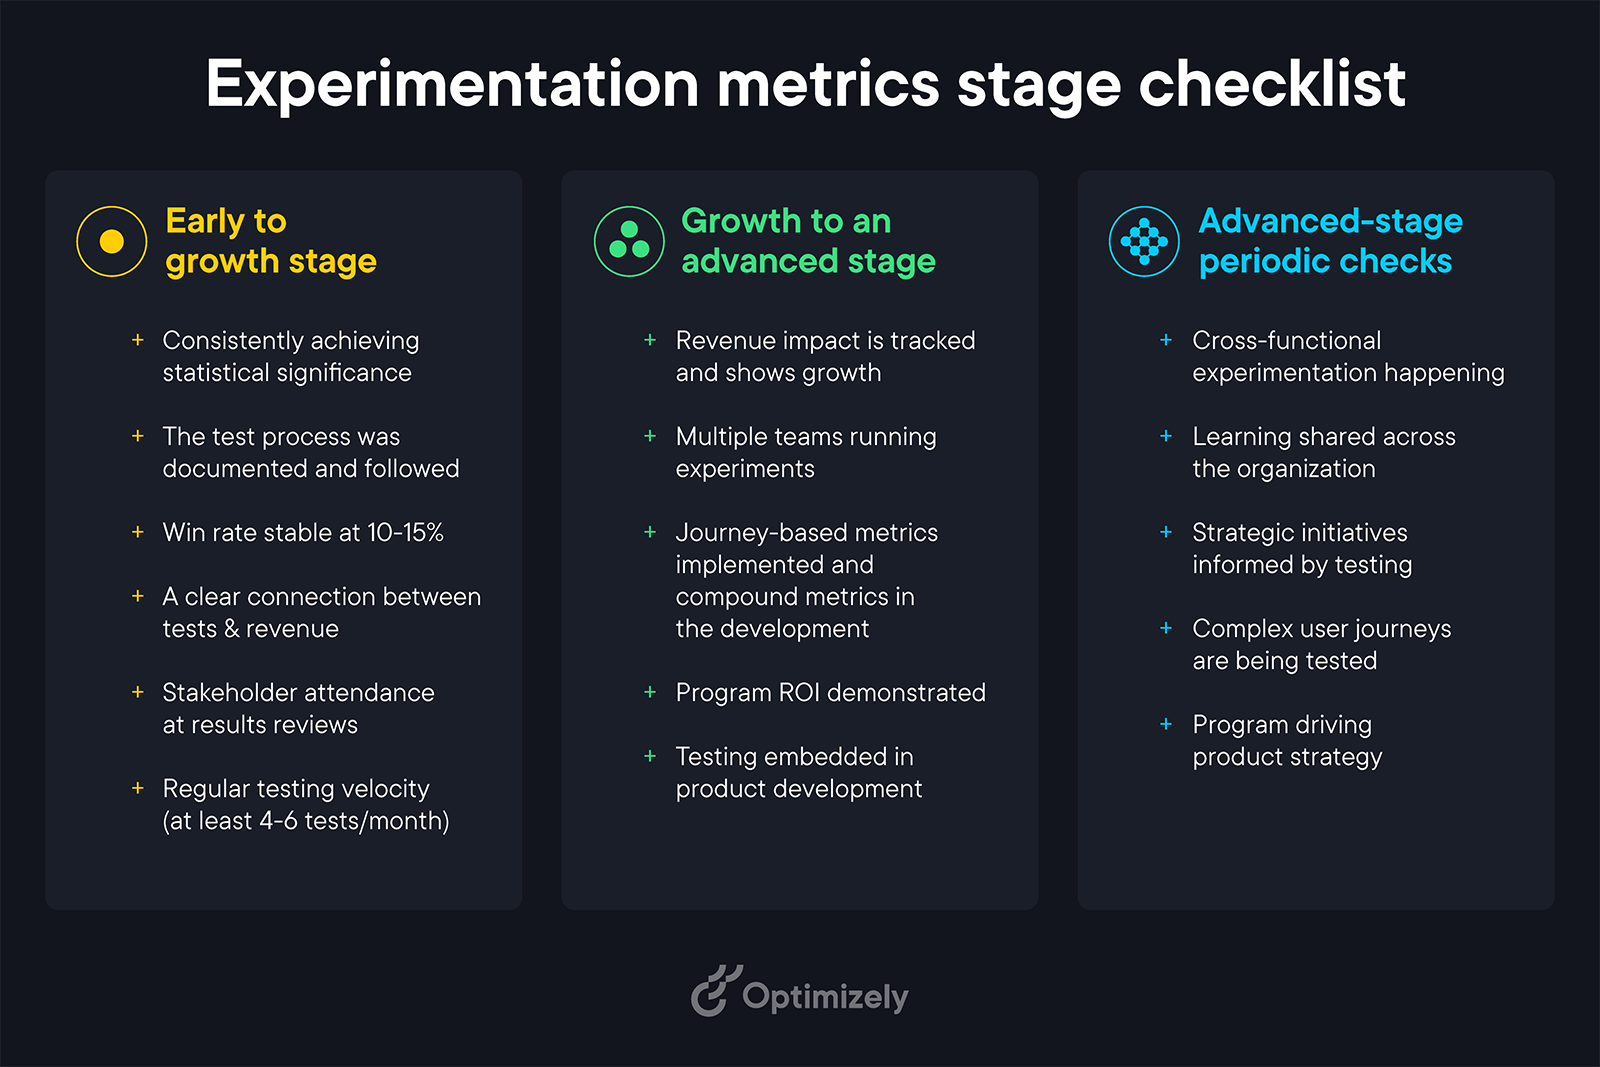
Every successful experimentation program goes through distinct stages. Here's how to evolve your metrics strategy at each phase and know when you're ready to level up.
1. Early stage: Building the foundation
At this stage, your primary goal is proving that experimentation works. You can start with two or three core metrics and a simple dashboard.

Focus areas:
- Basic conversion metrics that directly tie to revenue
- Test velocity to show program momentum
- Simple win/loss ratios for stakeholder communication
Success indicators:
- Consistent statistical significance in results
- Clear documentation of test learnings
- Basic ROI calculations for major wins
- Growing stakeholder interest in results
Example: Conversion rate, test velocity, simple win/loss ratios
2. Growth stage: Expanding impact
This is where your program starts driving meaningful business change. The metrics that got you here won't get you to the next level.
Key transitions:
- Move from counting tests to measuring business impact
- Start tracking revenue per experiment
- Introduce journey-based metrics
- Build deeper user behavior insights
Warning signs you're stuck:
- Too many small, superficial tests
- Difficulty connecting results to revenue
- Limited visibility into user journeys
- Stakeholders questioning program value
Example: Revenue uplift, customer journey impact, multi-touchpoint conversion rates
3. Advanced stage: Strategic driver
At this stage, experimentation becomes a core business driver. Your metrics need to reflect this strategic role.
Advanced metrics include:
- Compound metrics that reveal hidden opportunities
- Cross-team learning velocity
- Resource efficiency measurements
- Strategic risk avoidance rates
Example: Learning velocity, resource efficiency, strategic risk avoidance rate
Implementation guide
Five to do's to assess your metrics:
- Map your metric hierarchy: Distinguish between input metrics (user actions) and output metrics (business results). One retail customer discovered their "successful" tests were optimizing clicks but hurting purchases. More on how to maximize your KPIs.
- Question every metric: Ask "Why does this metric exist?" for each one. A B2B client reduced their metrics from 47 to 10 core measurements and saw stakeholder engagement double.
- Audit your data sources: Check where each metric's data comes from and how it's collected. Common pitfalls include siloed data and inconsistent tracking.
- Review statistical health: Verify sample sizes and significance rates. Are you waiting too long for results or making decisions too quickly?
- Check business alignment: Connect each metric to a specific business objective. Remove metrics that don't directly influence decisions.
This is how Carl Ras went from tracking basic conversion metrics to measuring complete customer journeys, revealing unexpected connections between product discovery and purchase behavior. The result was a 35% lift in online sales and 10% higher average order value.
Metrics implementation checklist:
1. Build your metric foundation
- Select 2-3 primary output metrics
- Define supporting input metrics
- Set clear monitoring thresholds
2. Enable cross-team success
- Create shared dashboards
- Establish review processes
- Track team-specific impacts
Frequently asked questions (FAQs)
Three at-a-glance takeaways
To wrap up, here are three takeaways:
- Grounding a hypothesis in data and measuring the right metrics
impact how teams perform ideation and design. Move on to the journey-based measurement that captures the complete customer experience. - Focus on compound metrics that combine different data points to reveal deeper insights, like pairing customer acquisition cost with lifetime value.
- Match metrics to your program's maturity. Start with core conversions, then expand to journey metrics, and finally advance to strategic measurements that drive business decisions.
- Last modified: 12/30/2025 7:52:48 PM

